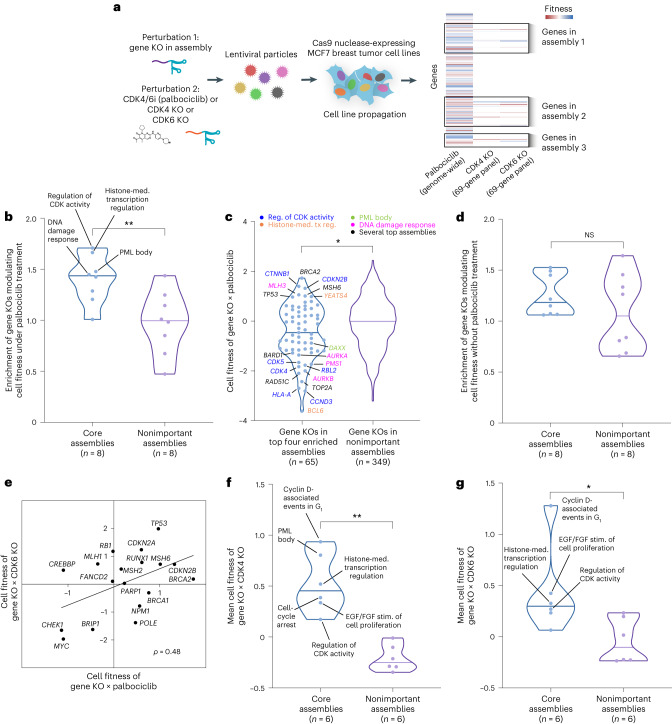
Fig. 4. Systematic validation of palbociclib response mechanisms.
a, Schematic overview of CRISPR screens in MCF7 breast tumor cells. Individual sgRNAs targeting genes in protein assemblies were combined with palbociclib (CDK4/6i) or a second sgRNA targeting CDK4 or CDK6. Cells harboring the Cas9 nuclease were infected with lentiviral-packaged sgRNAs and propagated under selection. The palbociclib screen was from Carpintero-Fernández et al.33; CDK4 and CDK6 KO screens were newly generated in the present study. b, Violin plots illustrating the enrichment of assemblies for gene KOs modulating cell fitness in the context of palbociclib treatment, comparing core assemblies defined by NeST-VNN versus the same number of nonimportant assemblies (randomly selected among those with importance < 0.5). **P < 0.01 by one-tailed Mann–Whitney U test. GSEA76 was conducted to calculate enrichment scores. c, Left, violin plot illustrating the effects on cell fitness due to CRISPR KO of each gene in the top four enriched assemblies shown in b. Point color indicates the assembly relevant to each gene. Right, similar plot showing the effects for gene KOs in nonimportant assemblies (negative control). Cell fitness is z score normalized across all tested gene KOs, with z > 0 indicating increased fitness relative to average and z < 0 indicating decreased fitness. *P < 0.05 by two-tailed Mann–Whitney U test. d, Violin plots illustrating the enrichment of assemblies for gene KOs modulating cell fitness without palbociclib treatment, comparing the core assemblies versus the same number of nonimportant assemblies. NS, not significant by one-tailed Mann–Whitney U test. e, Scatterplot of cell fitness of gene KOs in the context of CDK4/6i (x axis) versus CDK6 KO (y axis). Genes shown are from the top four assemblies in b (n = 18). f, Violin plots illustrating the mean fitness across gene KOs in core assemblies versus the same number of gene KOs from nonimportant assemblies in combination with CDK4 KO. **P < 0.01 by two-tailed Mann–Whitney U test. g, Same as f, except gene KOs are combined with CDK6 KO. *P < 0.05 by two-tailed Mann–Whitney U test. In f and g, two core assemblies did not have sufficient coverage in the gene panel; thus, six of the eight core assemblies were tested.

