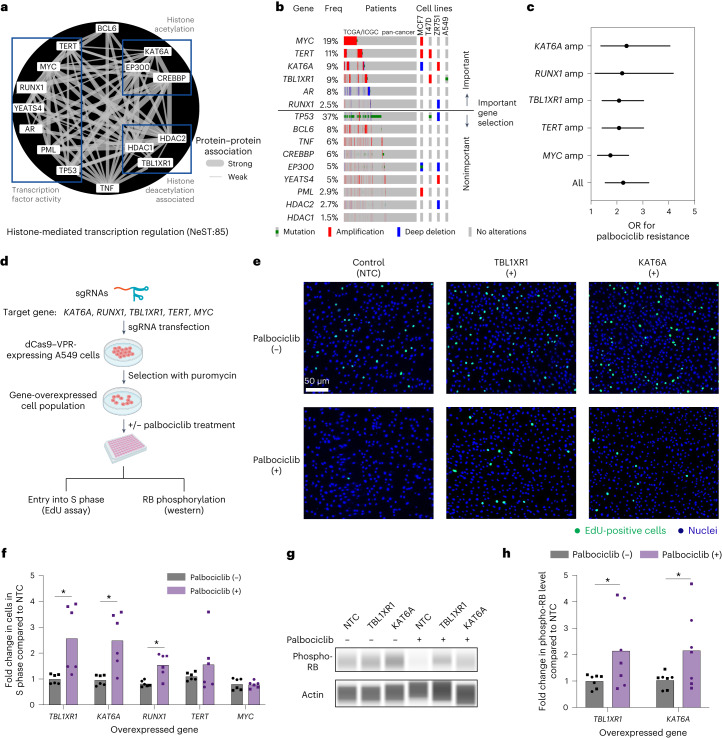
Fig. 5. Exploring the NeST:85 histone-related assembly in the palbociclib response.
a, Network diagram of NeST:85 depicting the histone-mediated transcription regulation assembly. Edges show protein–protein biophysical associations, with the edge thickness corresponding to the strength of the evidence for association. Three subgroups of protein functions are indicated in boxes. b, OncoPrint illustrating the genetic alteration patterns of NeST:85 genes (rows) in patient tumors from the TCGA/ICGC (International Cancer Genome Consortium) pan-cancer cohort (columns) along with representative cell lines (far right columns). Genes are sorted based on relative importance for drug resistance and then by alteration frequency (Freq) within each important or nonimportant group. c, ORs of important gene amplifications (amp) in NeST:85 with respect to palbociclib resistance in the TCGA/ICGC pan-cancer cohort. Error bars indicate the 95% confidence interval. d, Schematic overview of the CRISPRa gene overexpression screen. sgRNAs targeting the promoter regions of target genes were transfected into cells expressing the dCas9–VPR transcriptional activator. Effects were characterized by an EdU assay, which quantifies the number of cells undergoing active DNA synthesis, and by the phosphorylation status of RB, the molecular target of CDK4/6. Both palbociclib-treated and palbociclib-untreated conditions were examined. Created with BioRender.com. e, Cell microscopy images from an EdU incorporation assay for NTC (left), TBL1XR1 overexpression (middle) or KAT6A overexpression (right). EdU-positive cells indicating active DNA synthesis are stained in green versus nuclei stained in blue with DAPI. Images are shown for palbociclib-untreated (top) versus palbociclib-treated (bottom) cells. f, Bar plot depicting the fold increase in cells undergoing active DNA synthesis (S phase) due to overexpression of specific target genes (x axis) relative to NTC. *P < 0.05 by two-tailed Welch’s t test. Bars indicate mean; error bars indicate ±standard error; individual replicates are shown. Circle points indicate biological replicate 1 (n technical replicates = 3), and square points indicate biological replicate 2 (n technical replicates = 3). g, Capillary western blot analysis of phospho-RB levels for NTC, TBL1XR1 overexpression or KAT6A overexpression in palbociclib-treated or palbociclib-untreated (DMSO) conditions. A representative image from two independent experiments is shown. h, Bar plot depicting the fold increase in relative phospho-RB level (phospho-RB/actin) for the overexpression of specific target genes (x axis) relative to NTC. *P < 0.05 by two-tailed Welch’s t test. Bars indicate mean; error bars indicate ±standard error; individual replicates are shown. Circle points indicate biological replicate 1 (n technical replicates = 3), and square points indicate biological replicate 2 (n technical replicates = 4).

