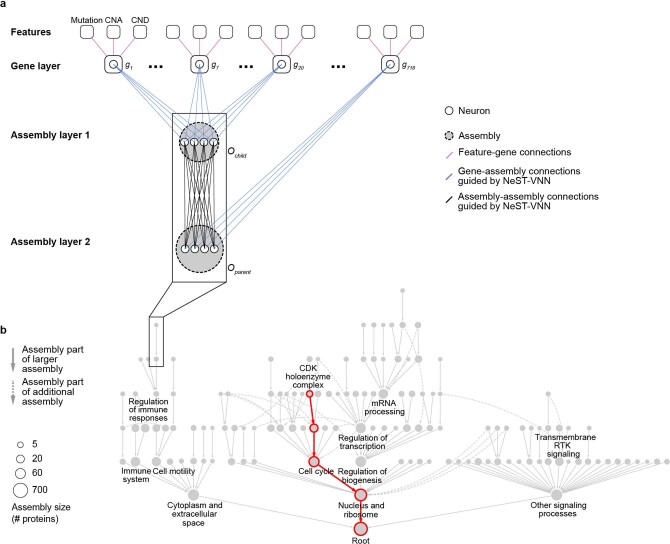
Extended Data Fig. 1. NeST-VNN schematic.
a, The first layer of NeST-VNN incorporates gene-level features, including gene mutations, copy number amplifications (CNA), and copy number deletions (CND). Subsequent assembly layers aggregate gene-level features into assembly-level information, guided by the hierarchical relationships defined by the NeST map. The output state of each gene (g) and assembly (O) is represented by artificial neurons (one neuron per gene, multiple neurons per assembly). b, Position of the assemblies detailed in panel a within the greater NeST map. Each node indicates a protein assembly. An example path of information flow, from the neurons of CDK holoenzyme complex to Cell cycle through to the model Root, is shown in red.

