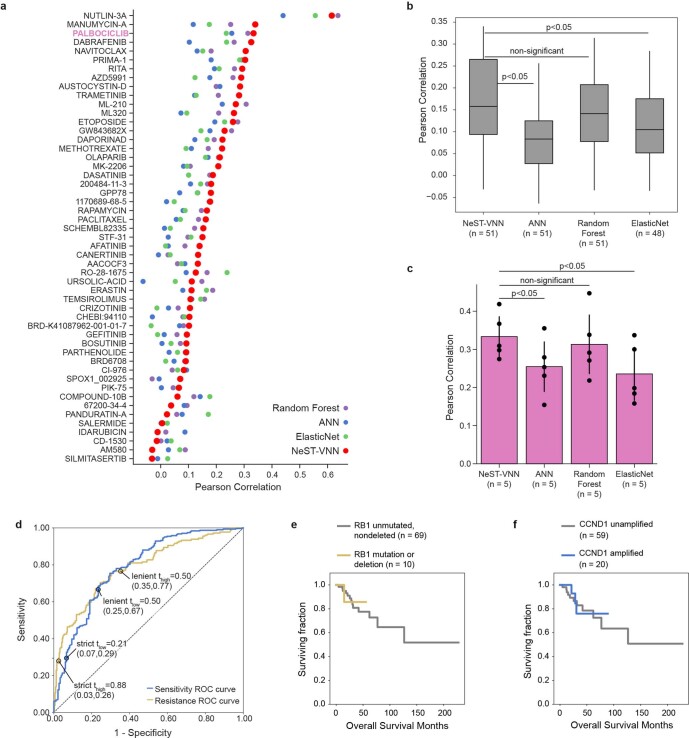
Extended Data Fig. 2. Supplemental model performance analysis.
a, Dot plot of model performance for each of 51 drugs for NeST-VNN (red) versus 3 alternate models: ElasticNet (green), Random Forest (purple), and a conventional Artificial Neural Network (ANN, blue). Palbociclib model highlighted in pink. b, Boxplot of performance for all drugs. Box plots show the 25th, 50th, and 75th percentiles of Pearson correlation. P-values reflect results of a one-tailed t-test assessing whether NeST-VNN outperforms baseline models. c, Bar chart of performance for palbociclib models. Error bars represent 95% confidence intervals with mean as the midpoint. P-values reflect results of one-tailed t-test. d, ROC curves for predicting resistance (yellow) or sensitivity (blue) to palbociclib. Marked points indicate cutoffs used to label samples as "resistant" or "sensitive" at different stringencies. Values in parenthesis indicate the (x,y) coordinate. e, Survival curves for CDK4/6i-treated patients stratified by somatic mutations or copy number deletions in RB1. f, Survival curves for CDK4/6i-treated patients stratified by somatic copy number amplifications in CCND1.

