Figure 2.
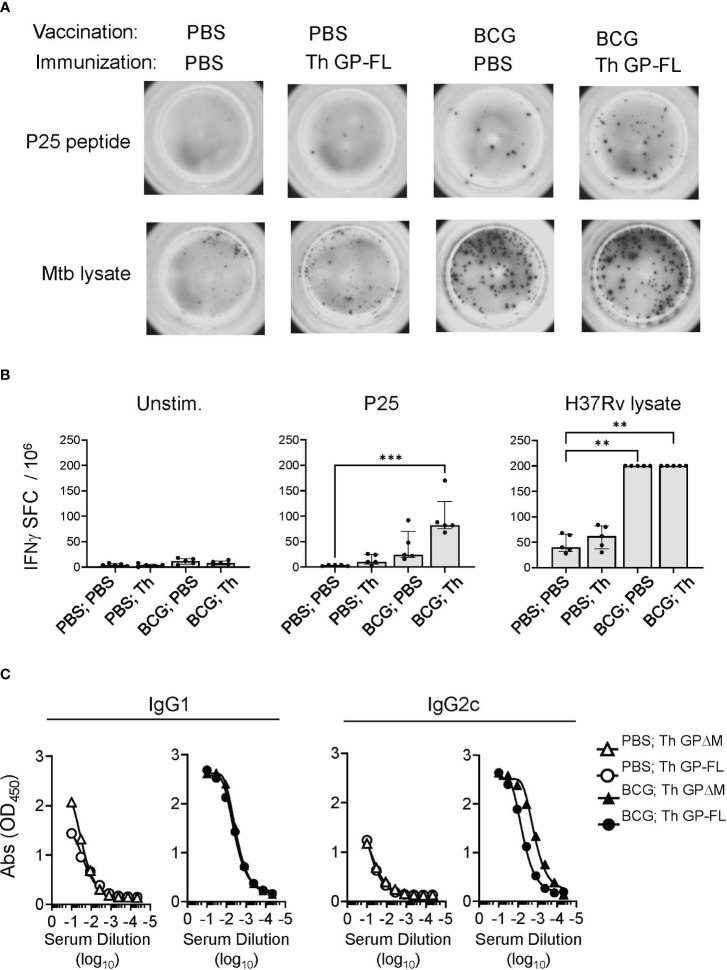
Induction of cellular and humoral immune responses by Th vaccines. For analysis of cellular responses, groups of mice (n = 5) were vaccinated with BCG or received sham vaccination with PBS injection, rested for 17 weeks and then immunized with the Th GP-FL or sham immunized (PBS). Two weeks after the immunization, IFNγ ELISPOT assays were performed on unstimulated, peptide-25 (P25) or Mtb (H37Rv lysate) stimulated splenocytes. (A) Representative spot forming cell (SFC) images of selected animals for each group. (B) Plots showing individual animal counts and group medians with interquartile range. Multiple columns were analyzed by Kruskal-Wallis one-way ANOVA, followed by Dunn’s multiple comparison test; (***p < 0.001 and **p < 0.01). Note that values for H37Rv lysate stimulation of BCG vaccinated groups are all plotted at the upper limit for accurate quantitation in the assay. (C) Mice (n = 5) were vaccinated with BCG or received sham vaccination with PBS injection, rested for 5 weeks and then prime and boosted with the EBOV GP vaccines (Th GP-FL or Th GPΔM). Two weeks after the boost, sera were collected, and antibody titers against EBOV GP (WT FL) were determined using ELISA specific for IgG1 or IgG2c isotypes.

