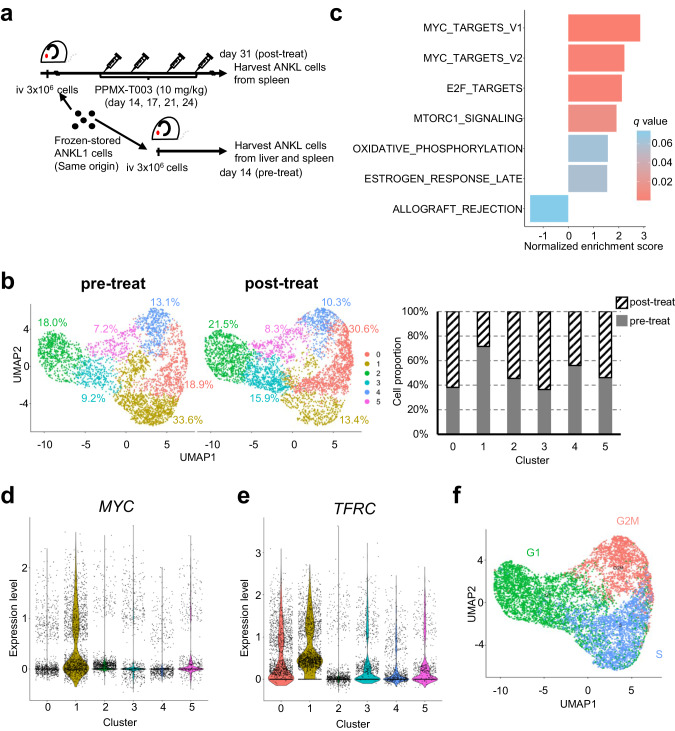
Fig. 3. PPMX-T003-sensitive ANKL cells were characterized by higher activity of the mTORC1/Myc/TfR1 axis.
a A schema of sample preparation for single-cell whole-transcriptome analysis. b Unsupervised clustering (UMAP) of analyzed ANKL1 cells. The bar graph indicates the cell populations of each cluster. c GSEA of feature genes in cluster 1. All annotated gene sets in HALLMARK of MSigDB with adjusted p-values lower than 0.25 were described. MYC (d) and TFRC (e) expression profiles of all the analyzed spleen-derived cells per cluster. Color consistency represents the amount of expression in each cell type. f Results of cell cycle scoring analysis of all the analyzed spleen-derived cells (left) and its schema describing cell cycle transition (right).

