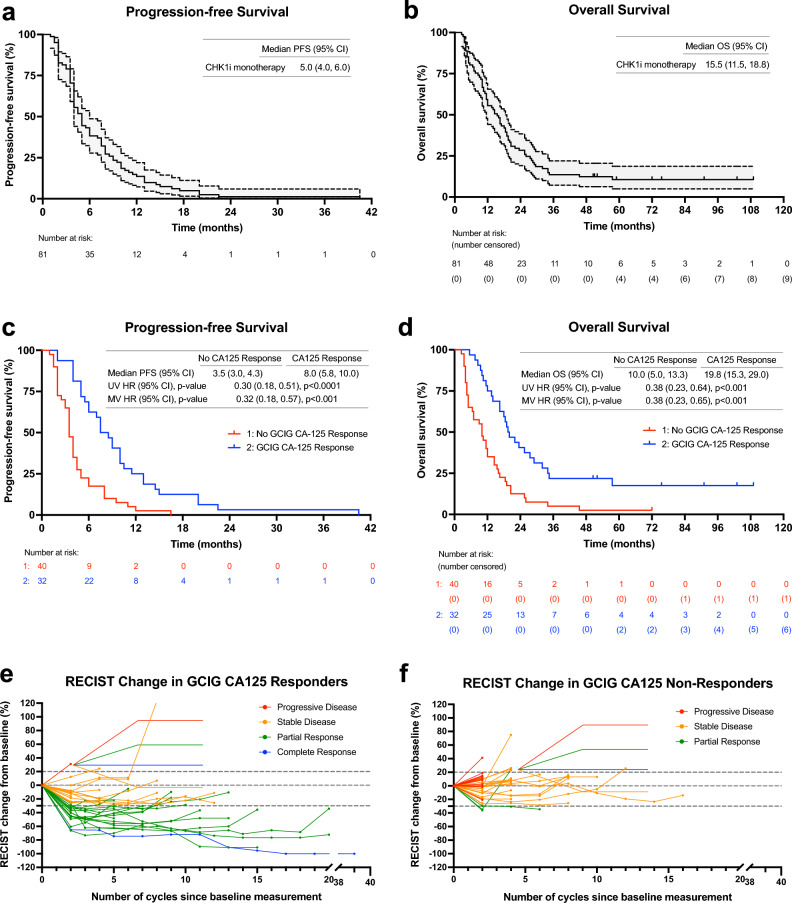
Figure 2.
Kaplan–Meier curves of (a) PFS and (b) OS of all patients treated with prexasertib with evaluable disease by RECIST (95% confidence interval shaded in gray). Censored patients are denoted by tick marks along the survival curves. Kaplan–Meier curves showing (c) PFS and (d) OS in patients separated by Gynecologic Cancer Intergroup (GCIG) CA125 response or no response. Spider plot of RECIST tumor size change from baseline in (e) patients with GCIG CA125 response and (f) patients with no GCIG CA125 response. CA125 cancer antigen 125, CHK1i cell cycle checkpoint kinase 1 inhibitor, GCIG Gynecologic Cancer InterGroup, HR hazard ratio, MV multivariate, OS overall survival, PFS progression-free survival, RECIST response evaluation criteria in solid tumors, UV univariate.

