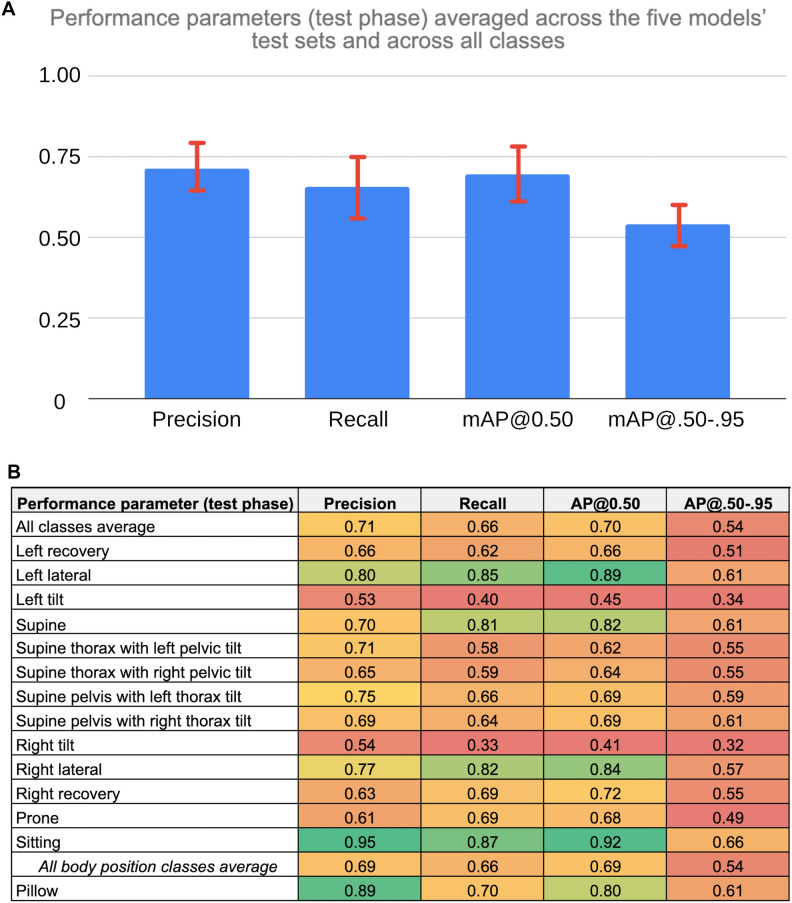
Figure 3.
(A) Bar Chart of SLeeP AIDePt-2 Performance Metrics From the Testing Phase Averaged Across the Five Models’ Test Sets and Across All Classes. Legend: mAP@0.50 indicates the mean average precision at an intersection of union of 0.50. mAP@.50-.95 indicates the mean average precision at intersections of unions between 0.50 and 0.95. The error bars represent one standard deviation of the respective value across all measures, which reflects the variability both across models and classes. The y-axis does not have units because precision, recall, mAP@0.50, and mAP@.50-.95 are dimensionless values. (B) Heatmap of SLeeP AIDePt-2 Performance Metrics (Columns) From the Testing Phase Averaged Across the Five Models’ Test Sets For Each of the Predicted Classes (Rows). Legend: AP@0.50 indicates the average precision at an intersection of union of 0.50. AP@.50-.95 indicates the average precision at intersections of unions between 0.50 and 0.95. The value of the respective performance metric is mapped to a colour spectrum from red to yellow to green where values of 0.50 or less are represented by red at the lower end of the spectrum, values around 0.75 are shades around yellow (oranger if lower than 0.75; greener if higher than 0.75), and values of 0.90 or more are represented by green at the higher end of the spectrum. The “all body position classes average” is provided as the averaged value of the respective performance metric across the five models’ test sets and the 13 body position classes. For the “all body position classes average” row, the value in the AP@0.50 column is the mean AP@0.50, and the value in the AP@.50-.95 column is the mean AP@.50-.95 since these values represent averages across multiple classes.

