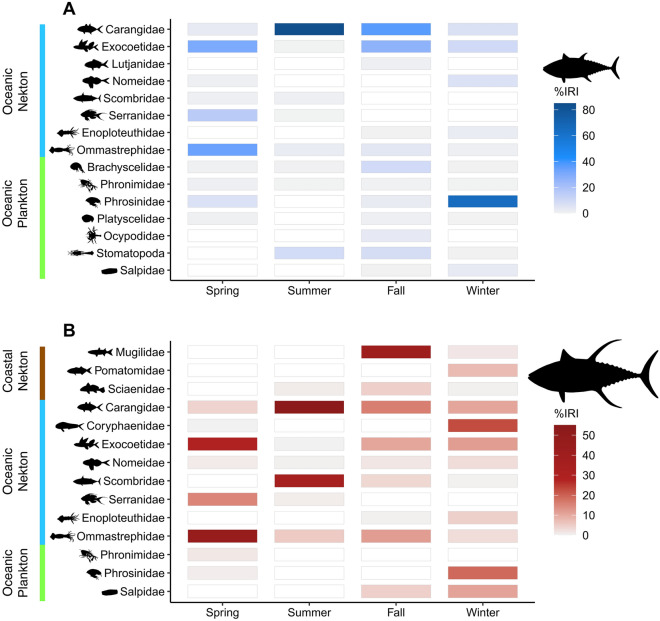
Figure 1.
Heat matrices showing the seasonal contribution of prey taxa that contributed at least 1% to %IRI (within any given season) to the diets of sub-adult (A) and adult (B) yellowfin tuna from the northern Gulf of Mexico (nGoM). Note, the %IRI legend for sub-adults and adults are on different scales. White regions represent a contribution of 0%IRI to the diet, while colored regions (color scale of gray to blue or gray to red) represent a contribution greater than 0%IRI. Darker shades of blue (A) and red (B) signify a higher contribution to %IRI. On the y-axis, prey taxa were categorized as coastal nekton (brown), oceanic nekton (blue), or oceanic plankton (green).

