. 2024 Jul 26;14(7):e084933. doi: 10.1136/bmjopen-2024-084933

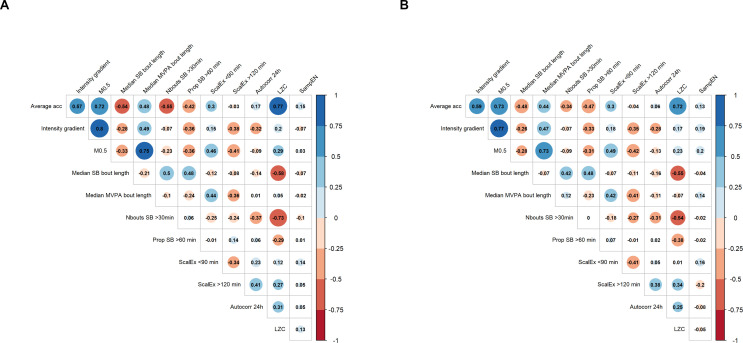
Figure 1. Correlation matrix of the movement behaviour variables for (A) women and (B) men. The size of the circle is proportional to the correlation strength. Red and blue colours represent negative and positive correlations, respectively. Autocorr 24 hours, autocorrelation at lag 24 hours; Average acc, average acceleration; LZC, Lempel Ziv complexity; M0.5, average acceleration above which the most active 30 min of the day were accumulated; MVPA, moderate-to-vigorous physical activity; Nbouts SB>30 min, number of prolonged sedentary bouts (>30 min); Prop SB>60 min, proportion of total SB time accumulated in bouts longer than 60 min; SampEn, sample entropy; SB, sedentary behaviour; ScalEx <90 min, scaling exponent alpha at small time scales (<90 min); ScalEx>120 min, scaling exponent alpha at large time scales (>120 min).

Figure 1