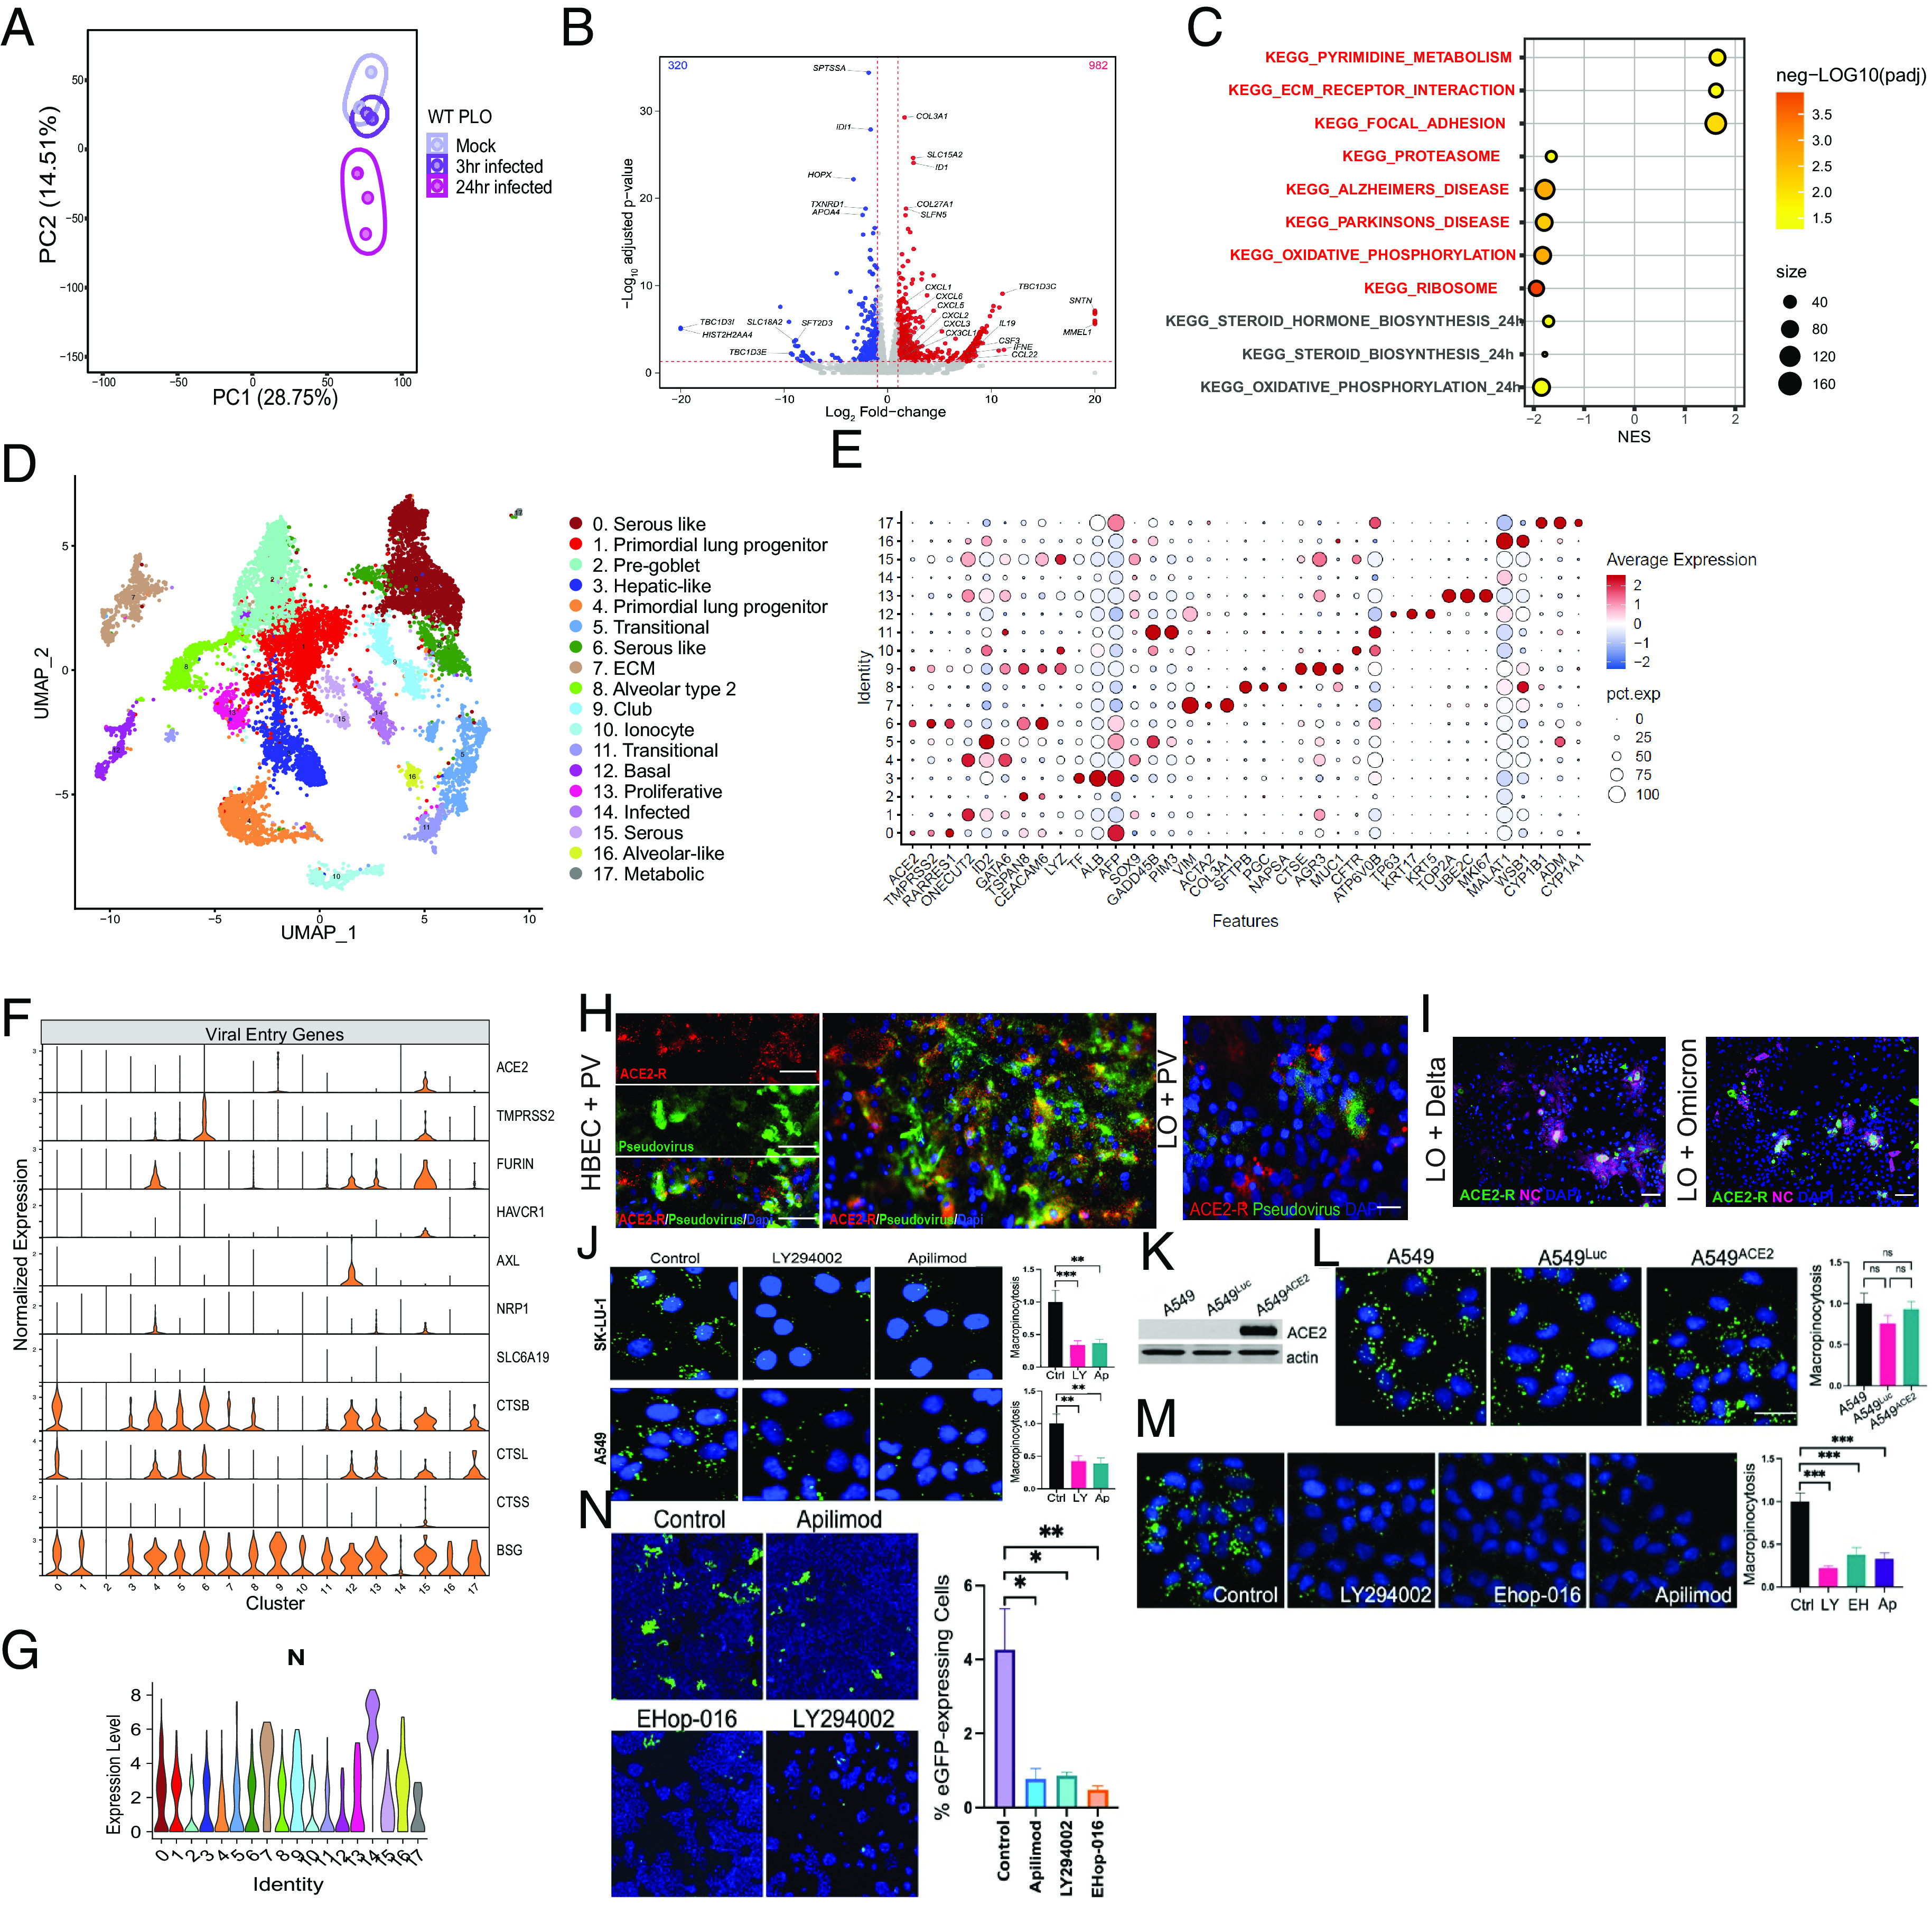
Fig. 2.

Transcriptional changes and tropism in hiPSC-LOs infected with SARS-CoV-2; many cell types can be infected, independent of ACE2. (A) PCA plot of the WT PLOs comparing samples that were uninfected (mock), 3 hpi, and 24 hpi. Note that PLOs infected for 24 h segregate from those infected for only 3 h or mock-infected. (B) Volcano plot analysis of differential expression of SARS-CoV-2 infected PLOs vs. mock infection. Note a heavy upregulation (red dots) of inflammatory cytokine. (C) Gene overrepresentation analysis using the KEGG pathway database of SARS-CoV-2 3 hpi vs. mock infected LOs. (D) UMAP of scRNAseq of 3D PLOs, 24 hpi with the alpha variant. Clusters were generated via Harmony Integration of three independent samples. The cell-type identity of each numbered, color-coded cluster is indicated in the list to the right of the UMAP. That same numbering scheme (Clusters 0 to 17) applies, as well, to Panels E–G. (E) Characteristic genes-per-cluster for the PLO scRNAseq data. The key to the heat map (degree of expression) and size of the circles (percent expression) is indicated toward the Right of the panel. (F) Violin plots of SARS-CoV-2 entry genes (including ACE2) present in each cluster in the PLOs. (Cluster identification as per E). (G) Violin plot of the SARS-CoV-2 NC transcript in the same clusters shown in Panel F. In cross-referencing between the two panels, note that N is present in some cells that contain the ACE2 transcript (e.g., Cluster 15), but also, significantly, in clusters that do not (e.g., Cluster 12). Viral genes in addition to N (further indicative of infection) are shown in these same clusters (and in every cluster) in SI Appendix, Fig. S4C. (H) Immunofluorescence images of both primary HBECs (Left) and acutely dissociated PLOs (Right) infected with SARS-CoV-2 pseudovirus show the pseudovirus in cells with and without ACE2, 4.1 ± 1% of the former and 0.72 ± 0.2% of the latter (I) Immunofluorescence images of dissociated hiPSC-PLOs infected with Delta and Omicron. Show viral NC in cells with and without the ACE2 receptor. (J–N) Proof that SARS-CoV-2 employs macropinocytosis (an endocytotic process quantified by FITC-Dextran [green] uptake) to enter lung cells, independent of ACE2, but which apilimod can block. (J) Prior to infection, SK-LU-1 lung cells were treated with 25 µM LY294002 (PI3K inhibitor) and A549 lung cells were treated with 100 µM LY294002, both used to block macropinocytotic mechanisms. Apilimod’s effects were then compared against these treatments. Macropinocytosis (green fluorescence) was inhibited by all drugs comparably; DMSO served as the negative control; **P<0.01 and ***P<0.001. (J) To show that ACE2 does not affect the extent of macropinocytosis, A549 cells were engineered to express ACE2 or just luciferase (Luc). Actin served as a loading control in the western blot. (L) FITC-Dextran uptake (macropinocytosis) was similar in A549 WT, A549Luc, and A549ACE2 cells (ns = not significant). (M) A549ACE2 cells were treated with LY294002, Ehop-016 (another endocytosis inhibitor via its suppression of Rac1 which perturbs actin cytoskeleton dynamics, and hence another positive control), apilimod, or DMSO (control). Macropinocytosis was still inhibited by all compounds, ***P < 0.001. (N) All the macropinocytosis inhibitors in L blocked SARS-CoV-2 infection of A549 cells as quantified by a large reduction in pseudovirus-eGFP-positivity (green) in those pretreated cells, compared to DMSO pretreatment. At least 15,000 cells/condition were analyzed for n = 3 replicates. *P < 0.05 and **P < 0.01.
