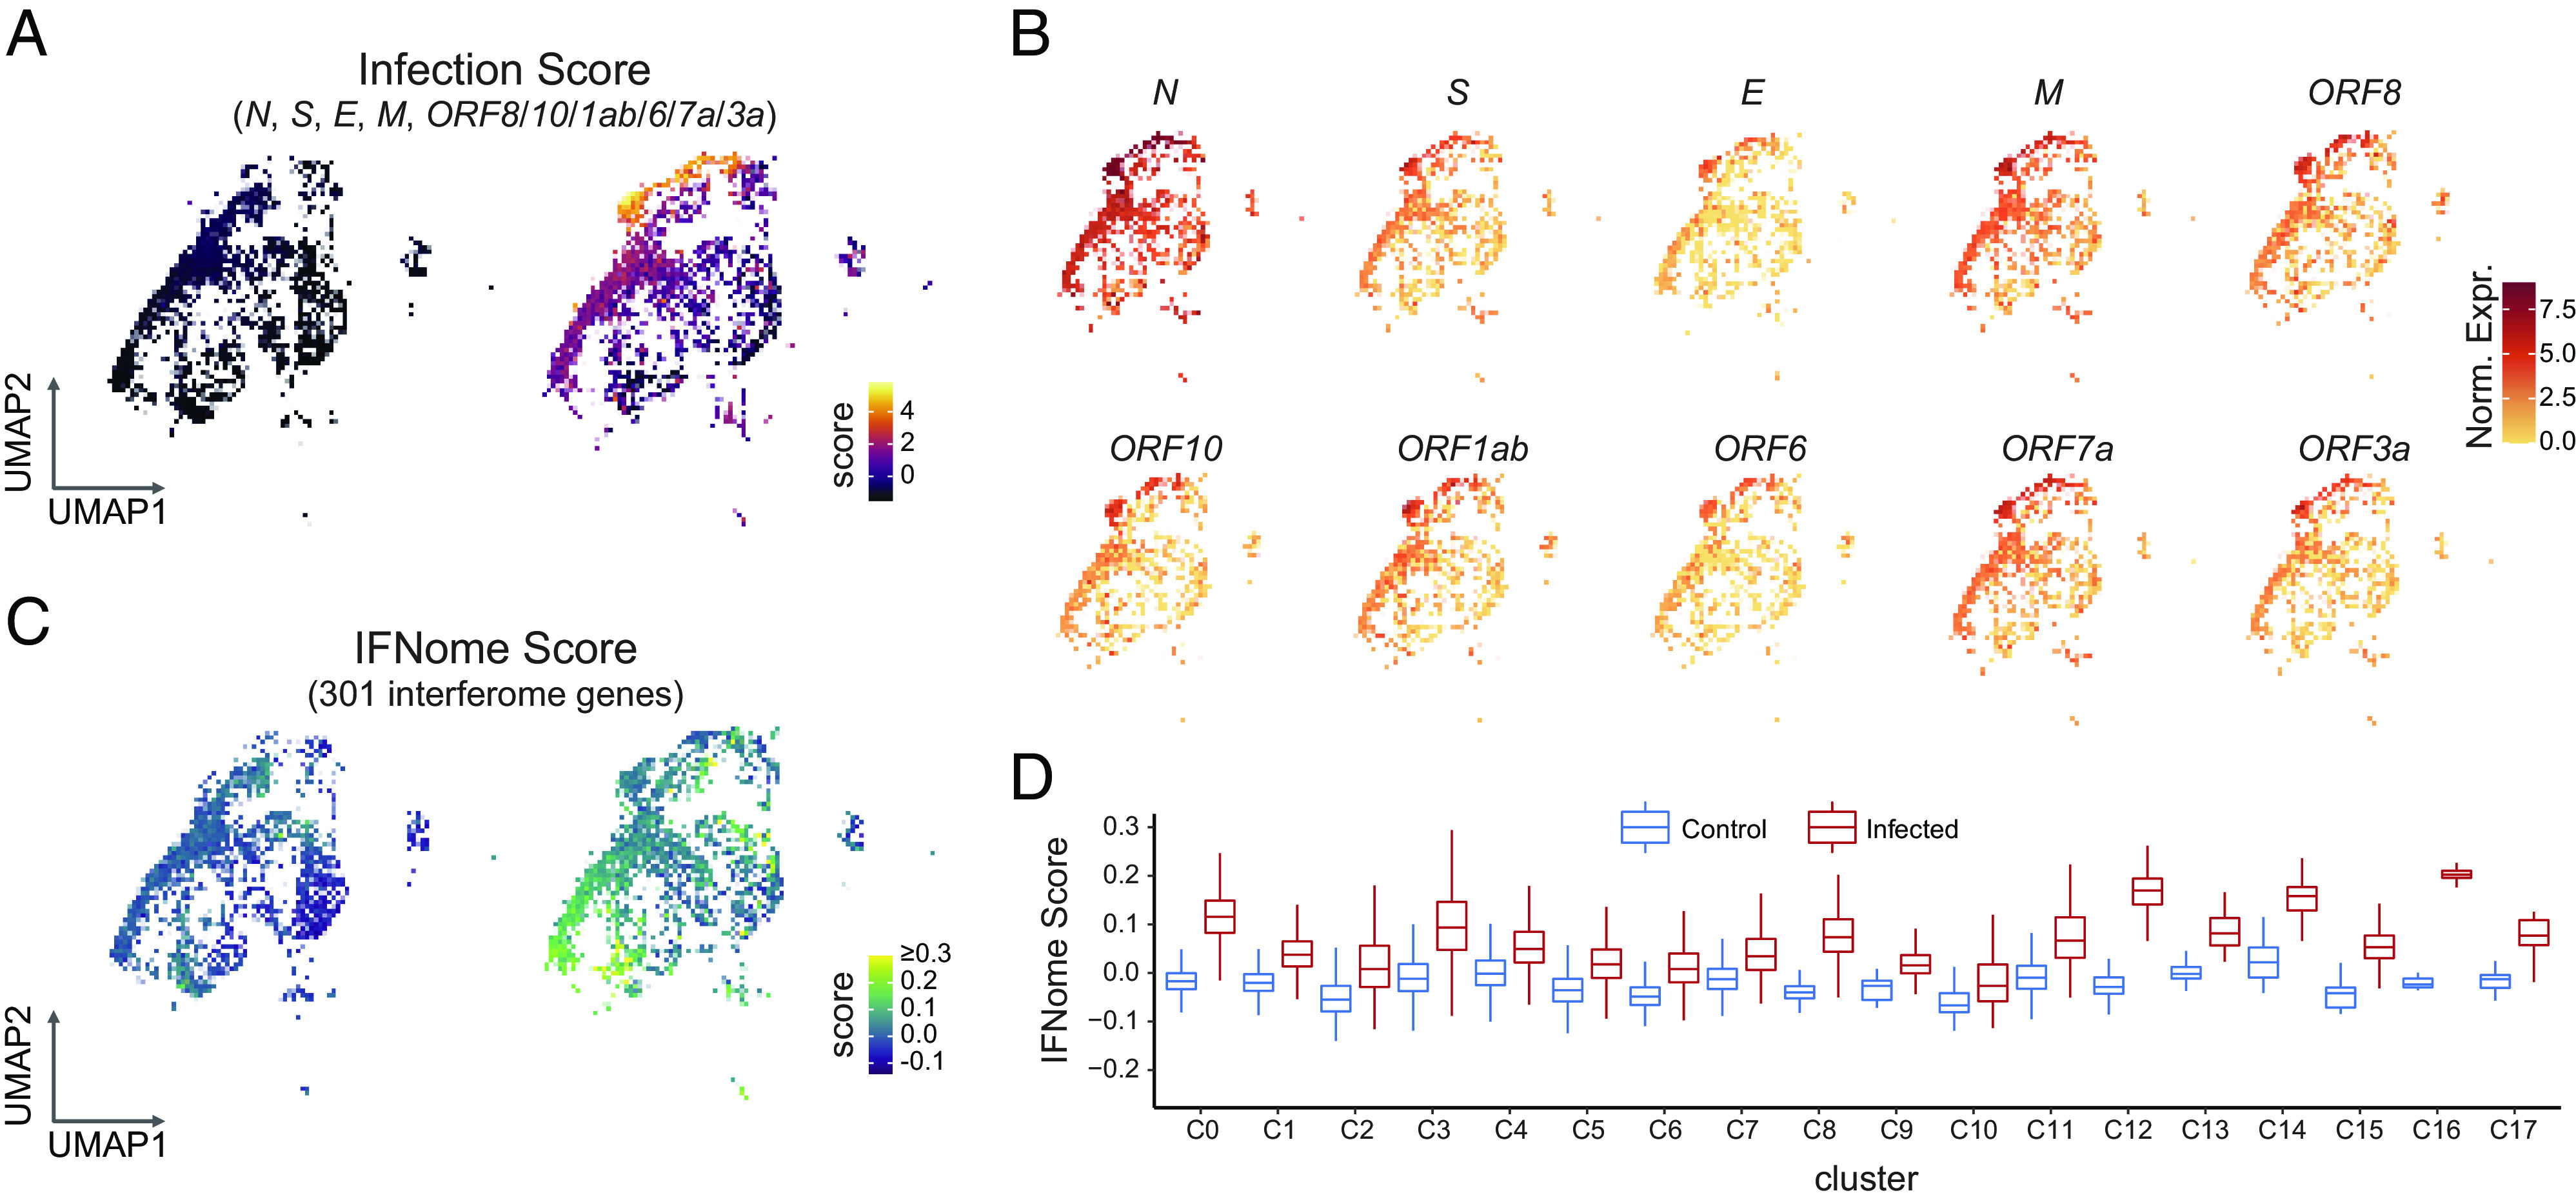
Fig. 3.

Acute infection with SARS-CoV-2 induces a lung-autonomous intrapulmonary inflammatory cascade in bystander cells. (A) UMAP of infection score showing the highest expression of SARS-CoV-2 genes in clusters 5 and 9. The significance of these clusters is described in the text. Highest expression levels are in yellow. (B) UMAP of viral gene expression. While N (viral NC) is expressed in all clusters, the complete complement of viral genes is expressed in clusters 5 and 9. Highest expression levels are in red. (C) UMAP depicting interferome-I (IFN-I) score for each cluster. Highest expression is seen in clusters 0, and 12 to 17. Clusters with the highest IFN-I scores did not overlap with clusters having the highest infection scores, suggesting that noninfected “bystander” lung cells were being induced by infection of their lung cell “neighbors” to mount an IFN response. Highest expression levels are in yellow. (D) Bar plots depicting a higher IFN-I score for each cluster when comparing mock vs. infected LOs.
