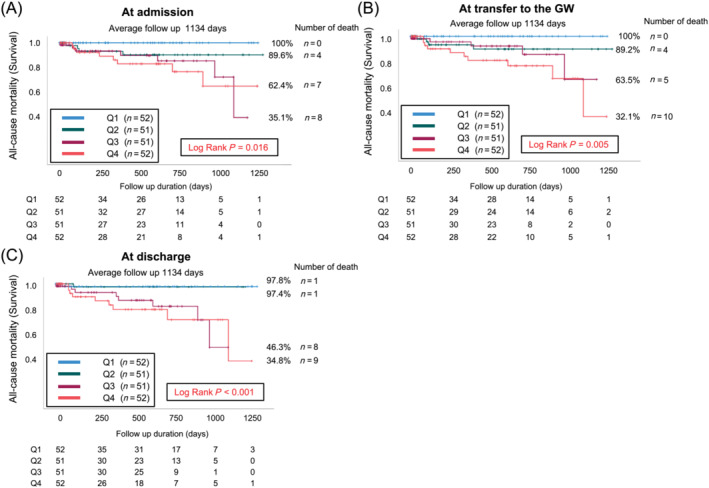
Figure 2.

Kaplan–Meier analyses stratified according to the quartiles of the plasma volume statuses of patients with acute decompensated heart failure at (A) admission, (B) transfer to the general ward (GW) and (C) discharge. Q1, Quartile 1; Q2, Quartile 2; Q3, Quartile 3; Q4, Quartile 4.
