Figure 7.

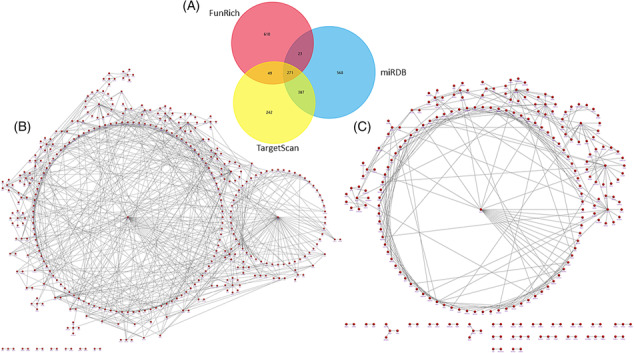
Biological pathways for predicted targets of miRNAs related to TR diagnosis (miR‐186‐5p, miR‐30e‐5p, and miR‐152‐3p). (A) Representative Venn diagram of the target prediction analysis methodology. (B) Graphical representation of the interaction of targets performed with the Uniprot database. (C) Graphical representation of the interaction of targets using the Funrich database.
