
Figure 1. Correlations Between Epigenetic Clocks and Epigenetic Age Acceleration.
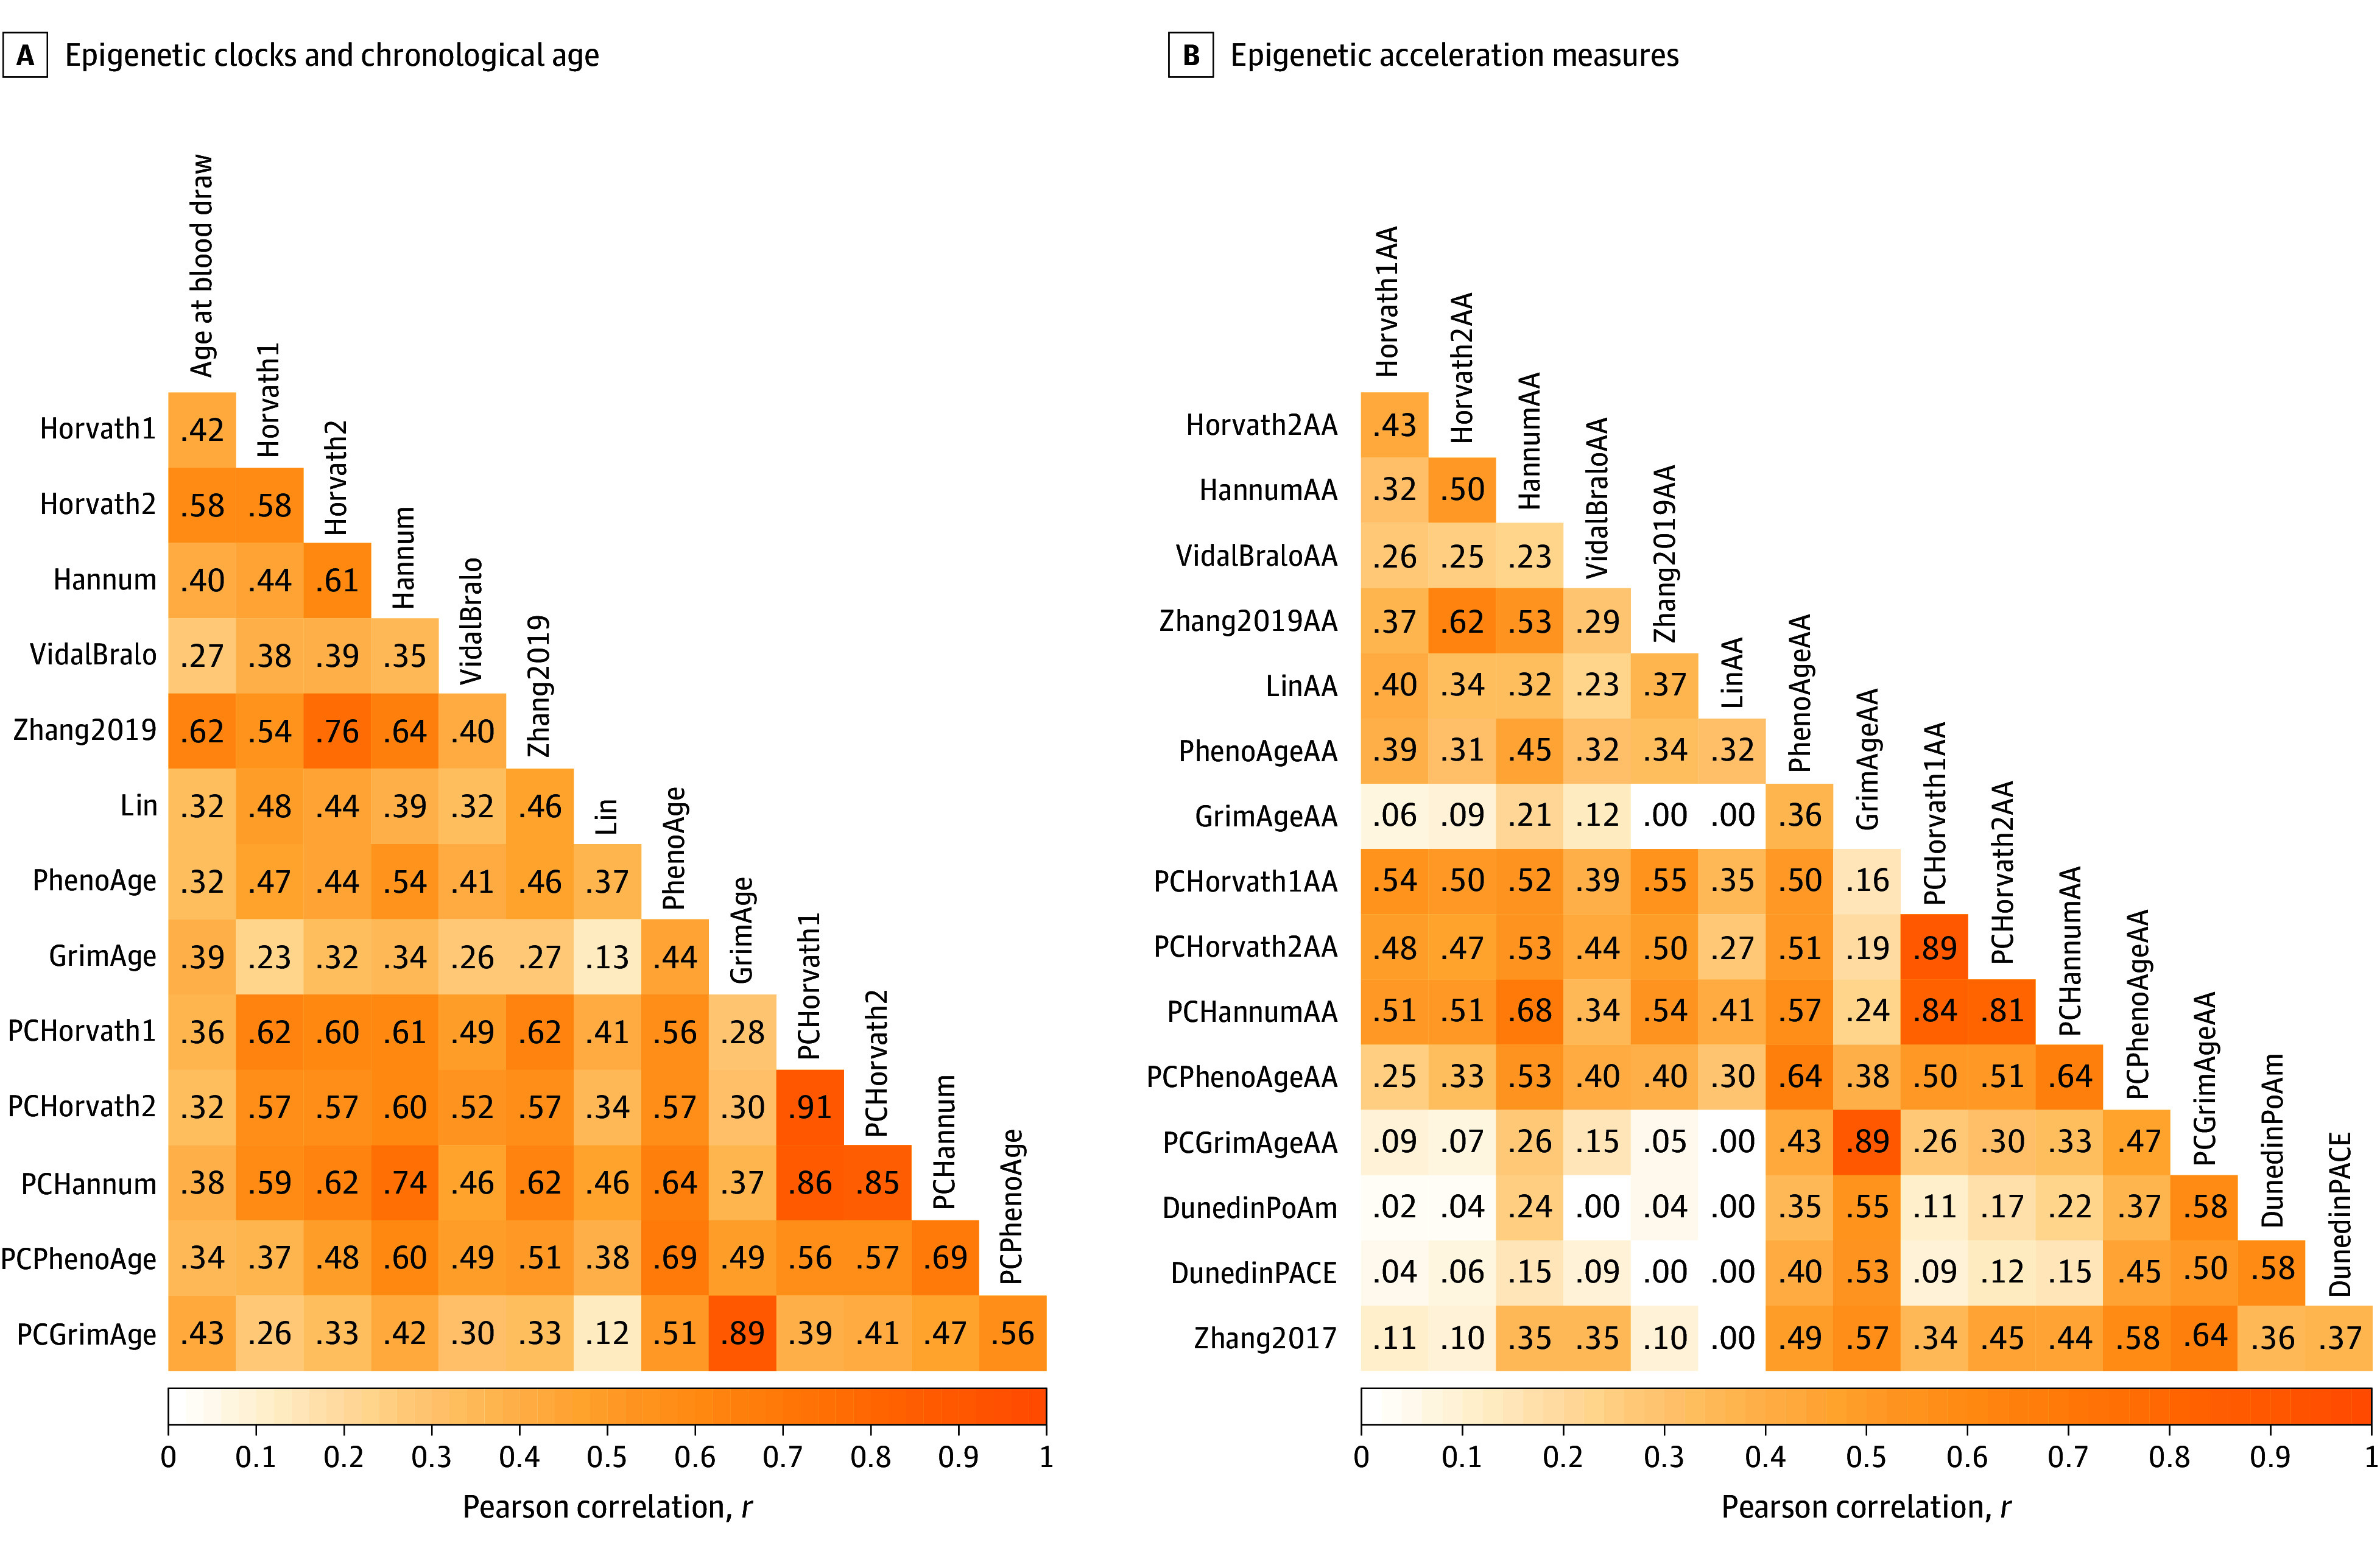
Correlations between epigenetic clocks and epigenetic age acceleration measures are depicted as a heat map. A, Pearson correlations among all epigenetic clocks for chronological age are presented. B, Pearson correlations among all epigenetic age acceleration measures, including third-generation rates of aging, are presented. Darker hues indicated a higher Pearson r correlation value.