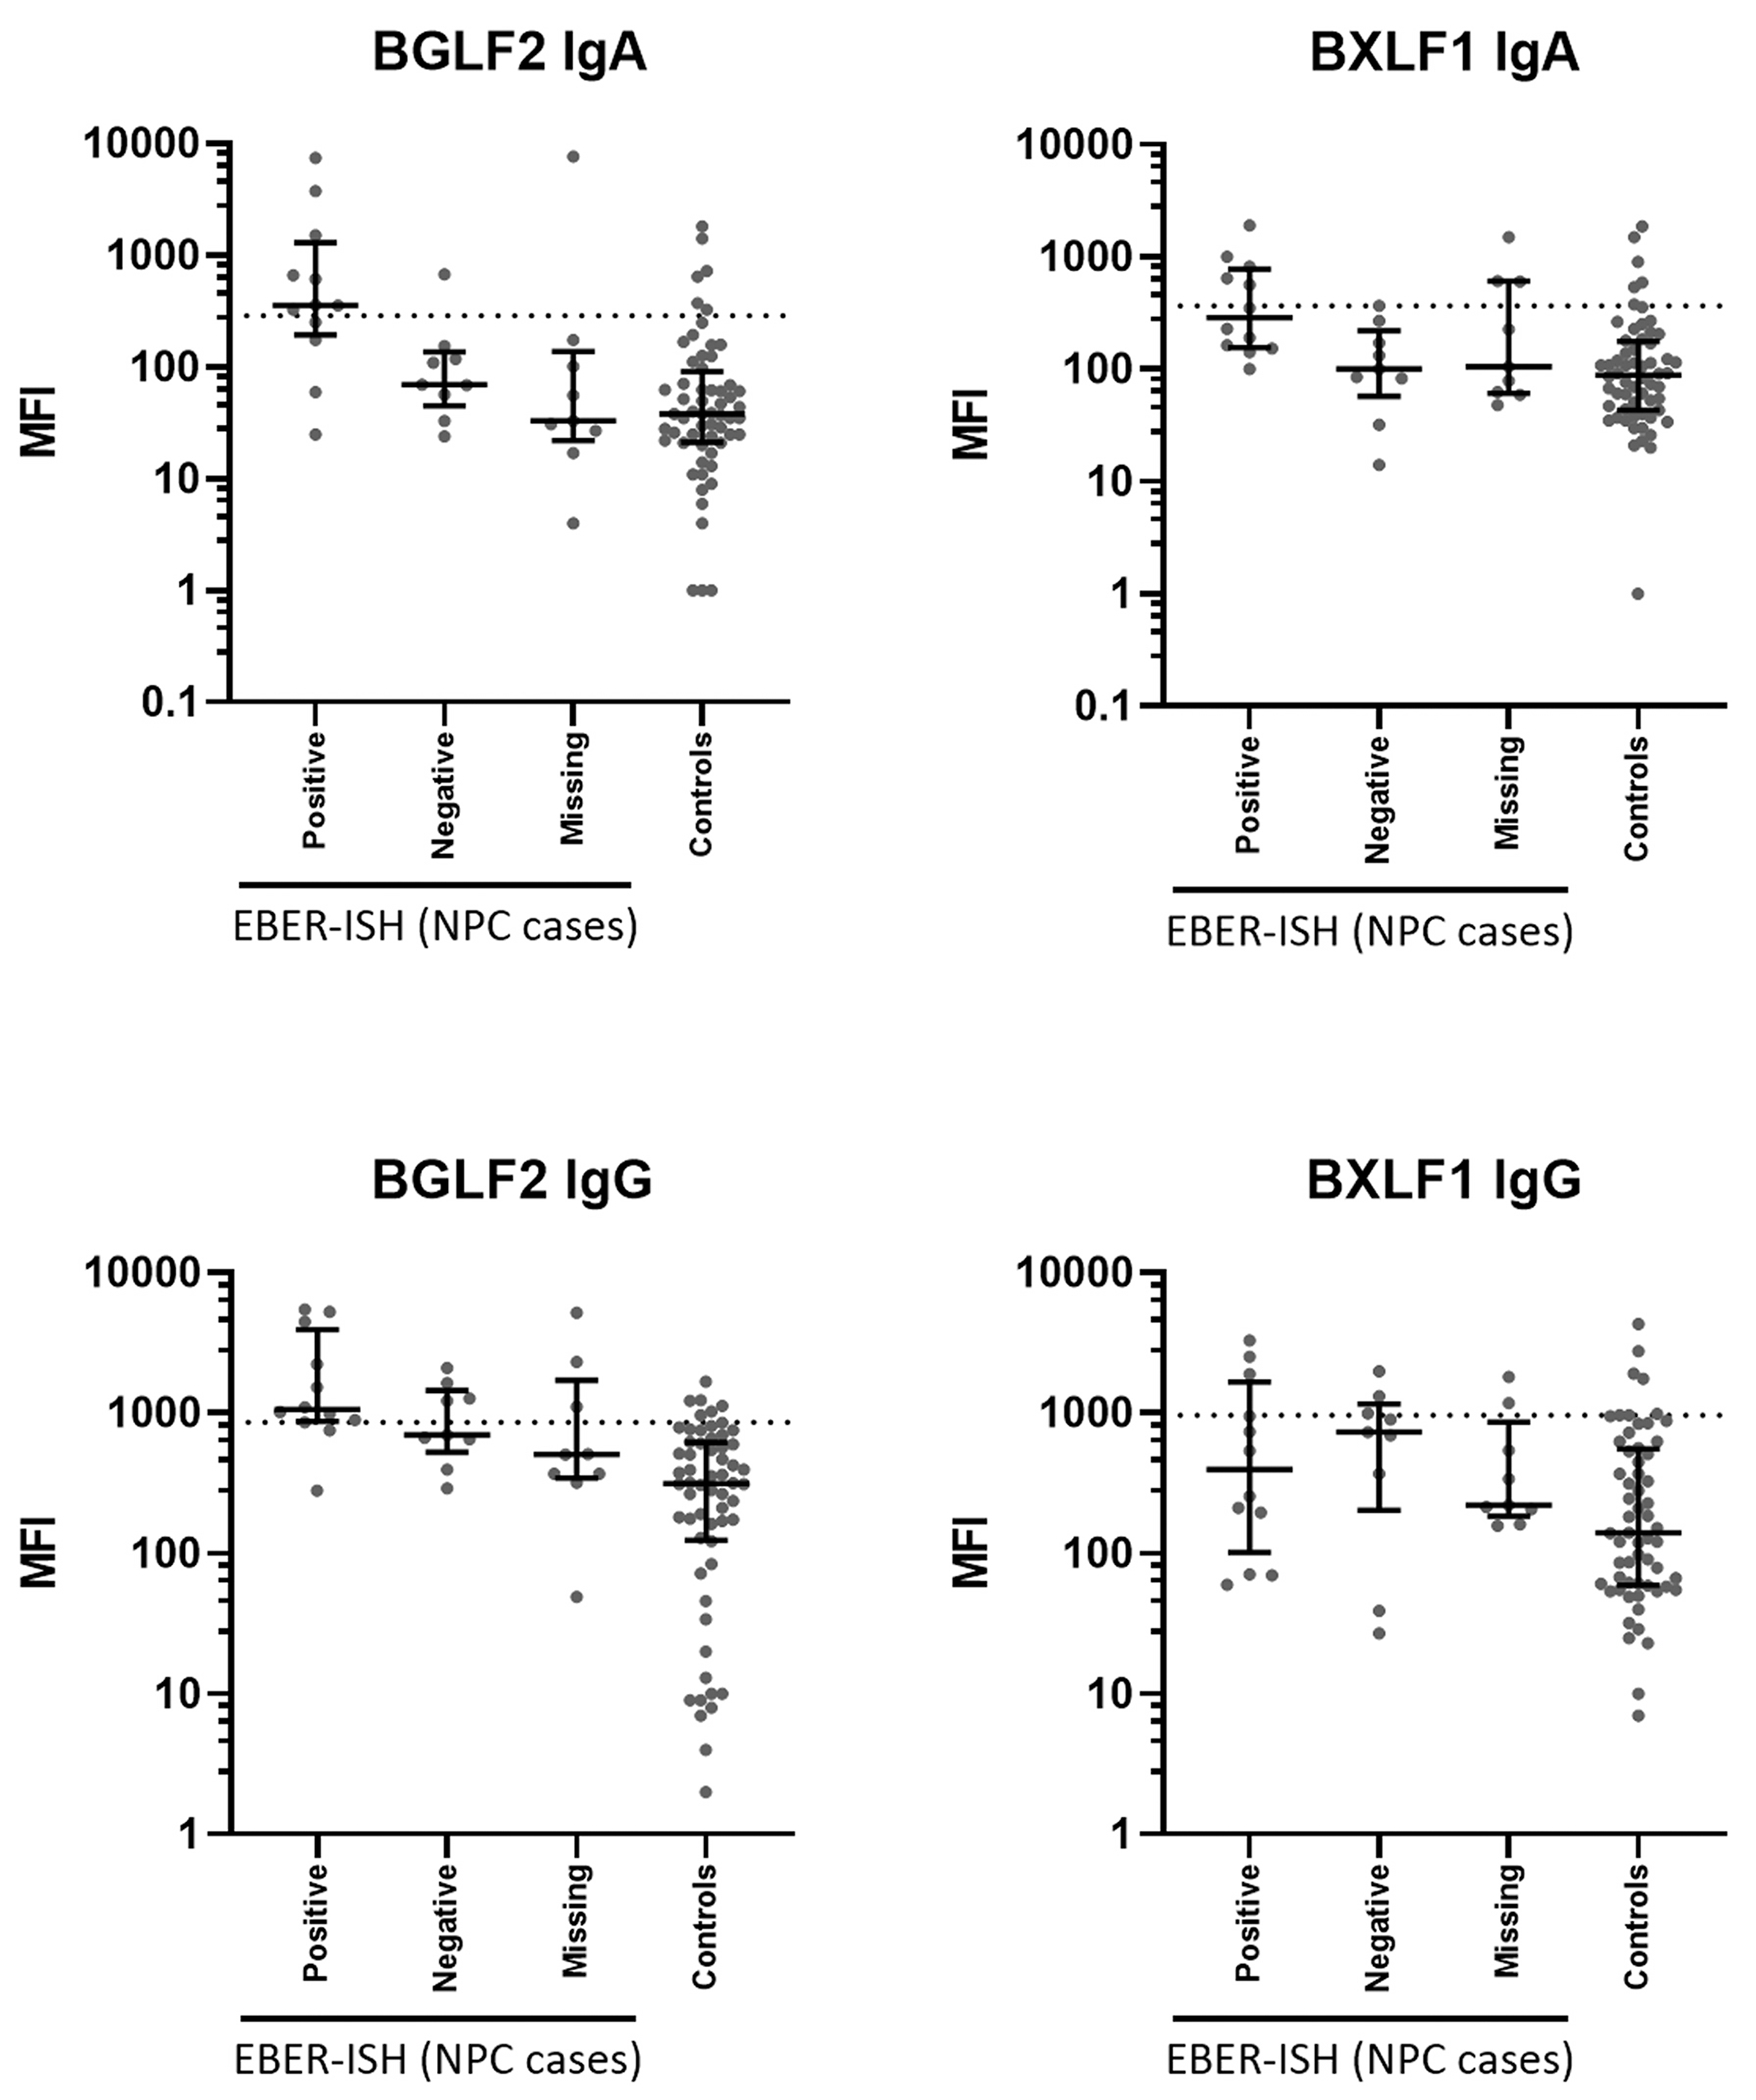
Fig. 1.

Median fluorescence intensity (MFI) values for BGLF2 and BXLF1 IgA and IgG antibodies. MFI values for all incident cases were split into Epstein-Barr virus small RNA 1 in situ hybridization (EBER-ISH) positive cases, EBER-ISH negative cases, cases with unknown EBER-ISH status and controls. Cut-offs are based on receiver operating characteristic (ROC) analysis to yield 90% seronegatives in the control group, i.e. 90% specificity.
