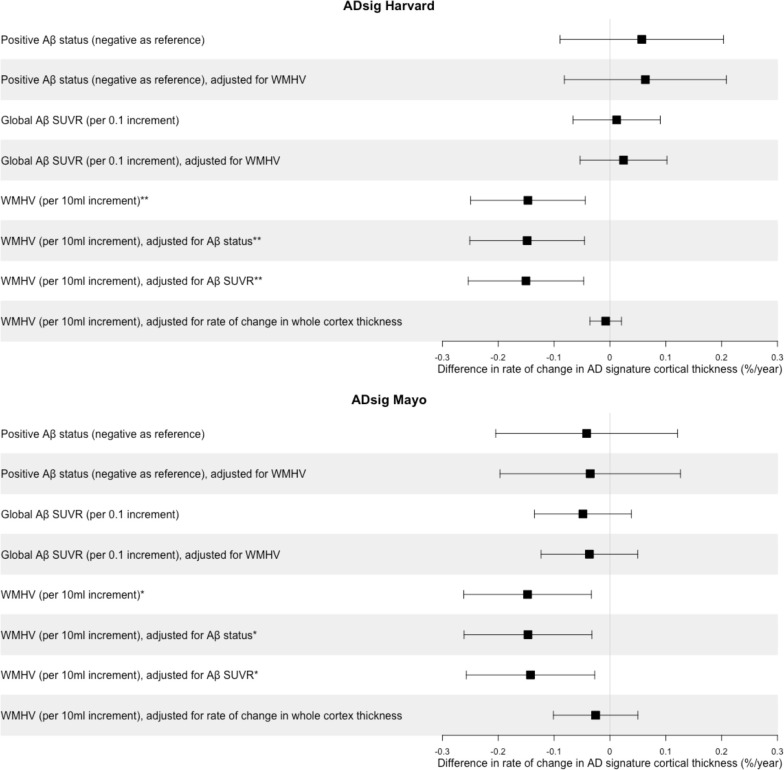
Figure 1.
Associations of baseline Aβ deposition and baseline WMHV with subsequent rates of change in cortical thickness in Alzheimer’s disease (AD) signature regions in cognitively normal participants. Coefficients and 95% CIs are presented from linear regression models, adjusted for sex and age at baseline scan. *p≤0.05; **p≤0.01. ADsig Harvard consisted of entorhinal, inferior temporal, parahippocampal, temporal pole, precuneus, supramarginal, superior and inferior parietal, superior frontal, pars opercularis, pars triangularis and pars orbitalis areas.3 ADsig Mayo was composed of middle temporal, inferior temporal, entorhinal and fusiform areas.4 Aβ, β-amyloid; SUVR, standardised uptake value ratio; WMHV, white matter hyperintensity volume.

