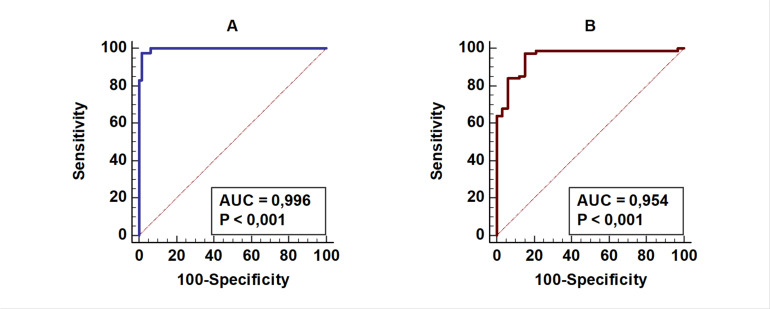
Fig. 3:
Prediction of ELISA test results by Geenius test results (A) and HIV-1 RT-PCR (B) using ROC curve analysis
(A) Prediction of the ELISA test results with Geenius test results using ROC curve analysis (n:145), AUC: Area under the curve: 0.996, P<0,001
(B) Prediction of ELISA test results with HIV-1 RT-PCR test results using ROC curve analysis (n:97) AUC: Area under the curve: 0.954, P<0,001
A moderately significant positive correlation (R: 0.582) was found between ELISA and NAAT results (P<0.001). We determined that as the ELISA index increased, the viral load increased in the same direction

