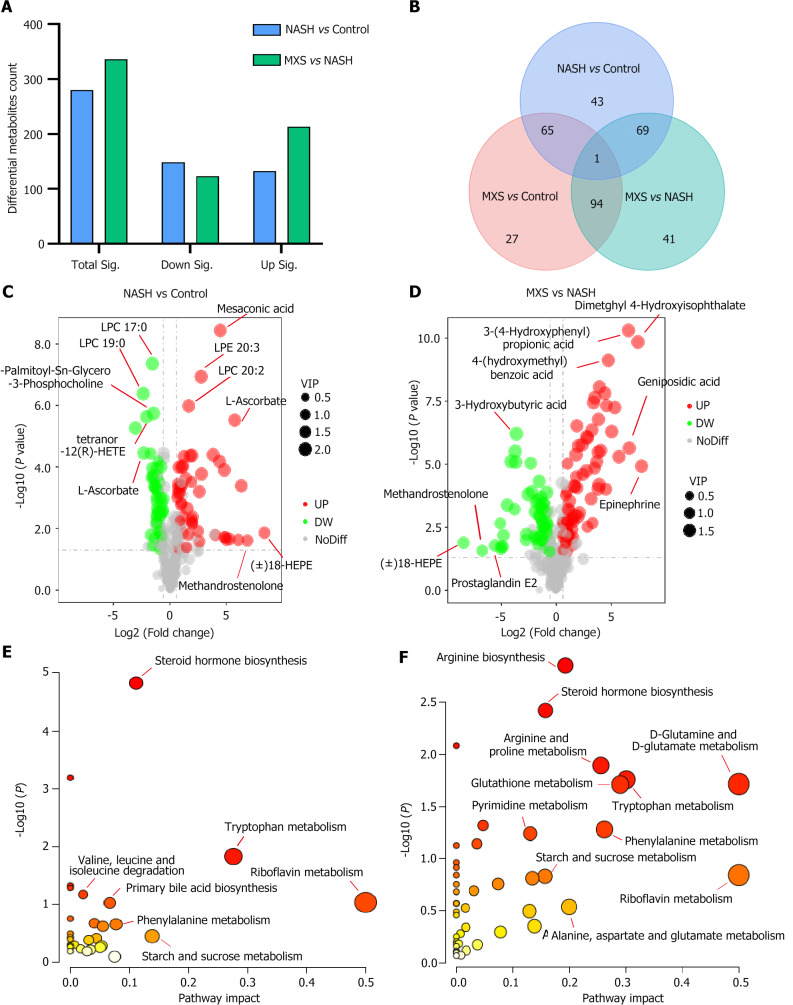
Figure 3.
Steroid hormone synthesis was the primary target pathway affected by modified Xiaoyao San treatment. A: Statistical analysis of differential metabolites. Total Sig denoted the total count of metabolites that exhibited significant changes. Down/up Sig represented the overall number of metabolites that underwent significant downregulation or upregulation; B: A Venn diagram illustrated the comparative analysis of metabolites among the three groups; C and D: Volcano plots displayed significantly changed metabolites, indicated by red and blue-colored dots. The criteria for significance were fold change (FC) below than 0.667, FC greater than 1.5, or variable importance in the projection greater than 1.0, and P value below than 0.05; E and F: Pathway enrichment analysis of differential metabolites in different comparisons. The pathway impact value (X-axis) was denoted by the size of the circles, and the -log10 P value weight (ranging from white to red, Y-axis) was indicated by the color intensity. MXS: Modified Xiaoyao San; NASH: Nonalcoholic steatohepatitis.

