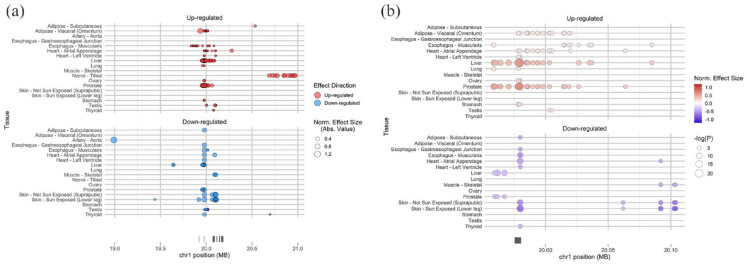
Figure 1.
Genome-wide SNPs that Impact PLA2G2A Gene Expression in Multiple Tissues. (a) The location of 234 eQTLs for PLA2G2A. X-axis shows the chromosomal position, and Y-axis shows tissues. The marker size indicates the magnitude of the effect size. The marker color indicates the effect direction in alternative alleles compared to reference alleles. (b) The location of 37 eQTLs shared among more than one tissue. X-axis shows the chromosomal position, and Y-axis shows tissues. The marker size indicates the magnitude of the negative logarithm of the P value. The color intensity indicates the magnitude of normalized effect size. The color indicates the effect direction in alternative alleles compared to reference alleles. Red: up-regulated, Blue: down-regulated. The genome-wide SNPs were examined using data from the GTEx project. The normalized effect size (NES) of the eQTLs is defined as the slope of the linear regression and is computed as the effect of the alternative allele (ALT) relative to the reference allele (REF) in the human genome reference GRCh38/hg38, as described in GTEx Portal (https://gtexportal.org/home/methods).

