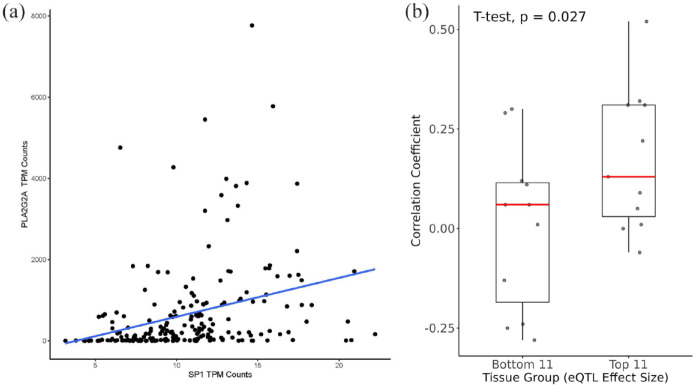
Figure 3.
Associations between PLA2G2A and SP1 gene expression in GTEx. (a) Correlation analysis of the gene expression between PLA2G2A and SP1 in the liver (r = 0.31). X-axis shows transcripts per million (TPM) of SP1 and Y-axis shows TPM of PLA2G2A. (b) Box plots of the correlation coefficients between SP1 and PLA2G2A TPMs across tissues. Top 11: Top 11 tissues by multitissue posterior probability of effect (m-value) of the eQTL rs11573156. Bottom 11: bottom 11 tissues by m-value.

