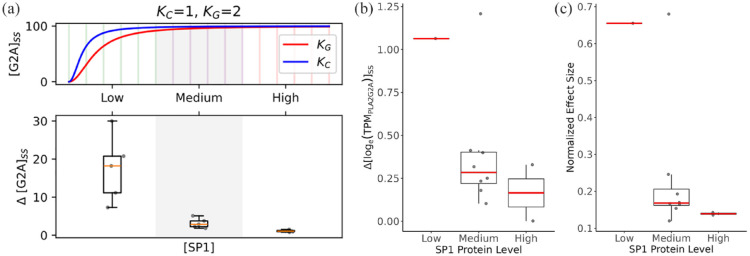
Figure 4.
The impact of SP1 protein levels on allele-specific PLA2G2A gene expression across tissues. (a) Modeled PLA2G2A allele expression. In the upper panel, the ODE across an arbitrary range of SP1 level ([SP1]) (x-axis) was simulated to get the steady-state PLA2G2A expression level ([G2A]ss) corresponding to the C and G alleles of rs11573156 (Kc and KG, respectively). In the lower panel, (y-axis) indicates the difference in the C and G allele PLA2G2A expression levels, which is box-plotted against [SP1] (x-axis) spanning 3 categories (with 5 bins in each category, as indicated in the top panel). The model parameters are (b) Empirical delta PLA2G2A allele expression. The differences (delta logTPM) of PLA2G2A transcript levels by genotype (C vs G allele at rs11573156) were calculated in each tissue based on the GTEx dataset and box-plotted against the 3 categories of SP1 protein levels (low, medium, and high) as in a. (c) Normalized effect size of rs11573156 in each tissue box-plotted against the 3 categories of SP1 protein levels as in a.

