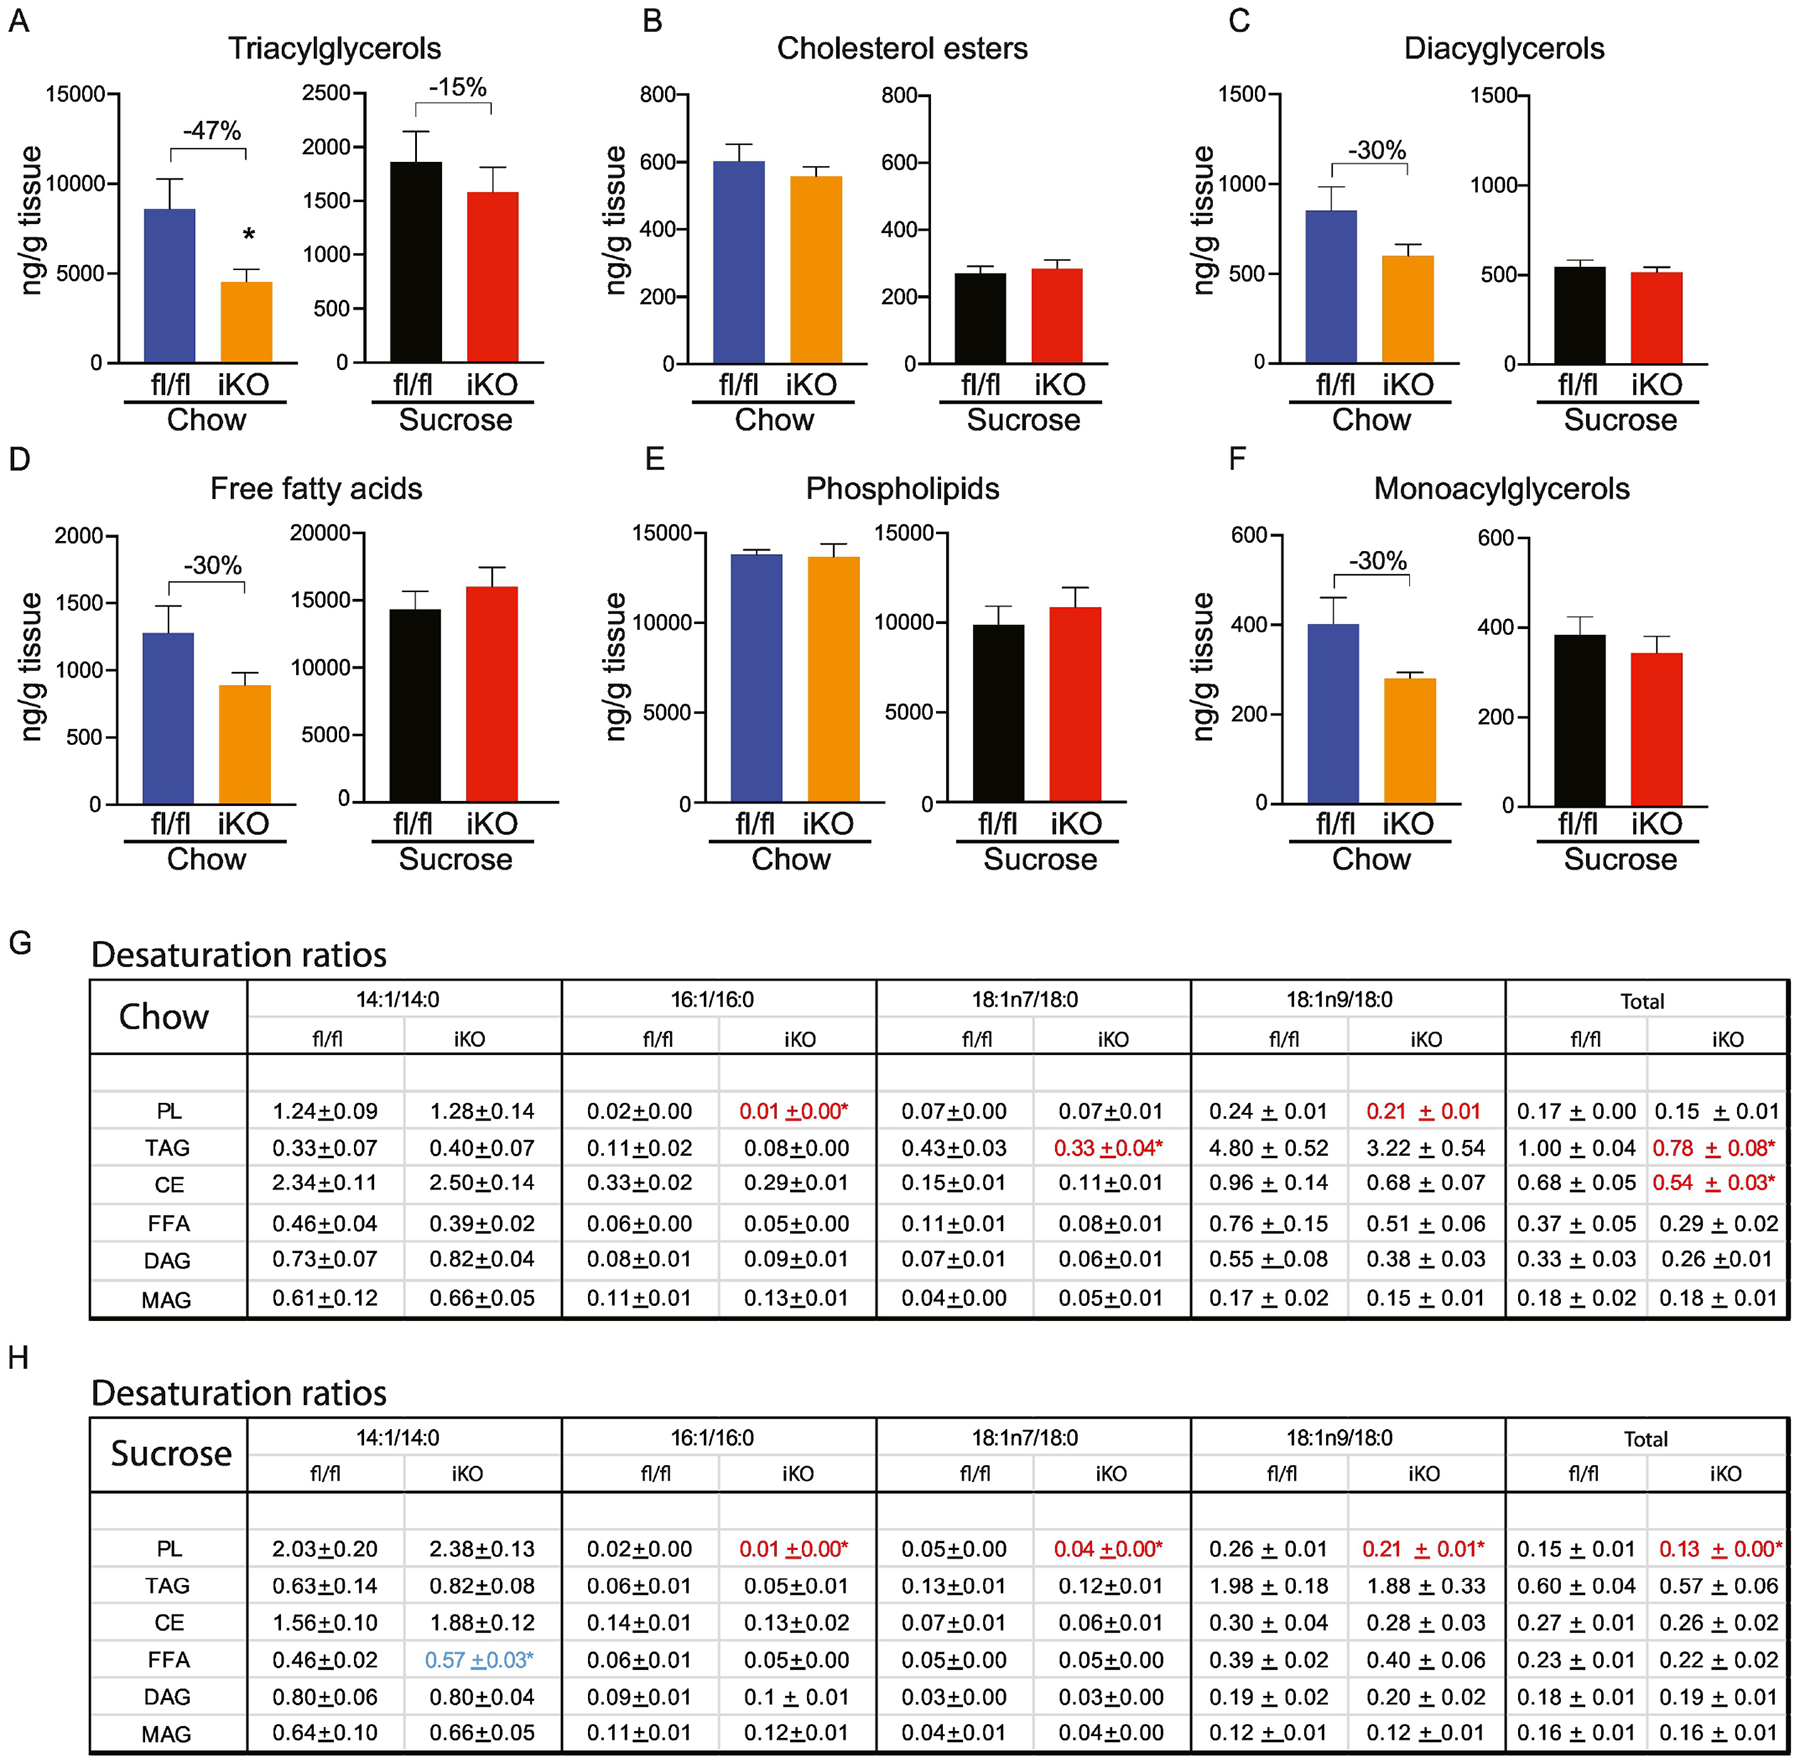
Figure 5. Lipidomic changes in proximal intestine of iKO mice.

(A-F) Total content of triacylglycerols (TAG), cholesterol esters (CE), diacylglycerols (DAG), free fatty acids (FFA), and phospholipids (PL), and monoacylglycerols was determined by TLC-GC-MS using mucosal scrapings from proximal small intestines. (G, H) Desaturation ratios for 14–18 carbon chain lipid species were calculated for each lipid fraction from chow-fed and sucrose-fed mice. Red text denotes desaturation ratios that were significantly reduced, and blue text denotes desaturation ratios that were significantly increased in iKO mice, relative to diet-matched fl/fl controls. n=6. Averages ± SEM. *p<0.05 vs fl/fl.
