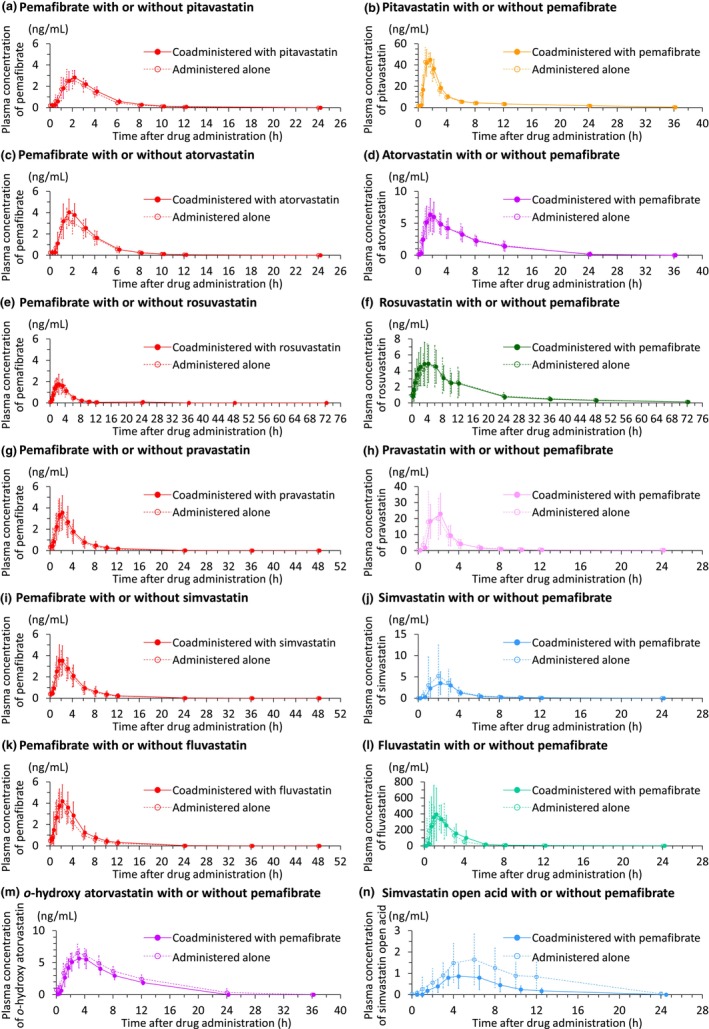
FIGURE 2.

Plasma concentration–time curves for pemafibrate and statins in the studies with pitavastatin (a, b; n = 18), atorvastatin (c, d; n = 18), rosuvastatin (e, f; n = 24), pravastatin (g, h; n = 18), simvastatin (i, j; n = 19†), and fluvastatin (k, l; n = 19‡), and those for o‐hydroxy atorvastatin (m; n = 18) and simvastatin open acid form (n; n = 19) in the studies with atorvastatin and simvastatin, respectively. Data are presented as mean ± SD. Solid circles and lines indicate data with coadministration, and open circles and dashed lines indicate those without coadministration. † n = 18 for pemafibrate administered alone. ‡ n = 18 except for pemafibrate administered alone.
