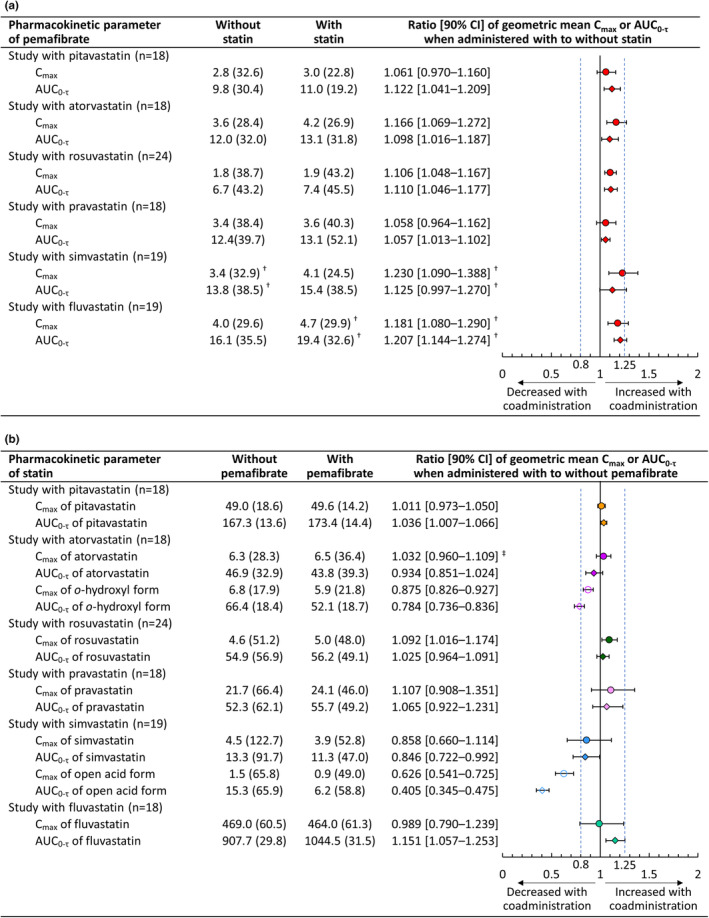
FIGURE 3.

Geometric means for C max and AUC0‐τ of pemafibrate, when administered alone or coadministered with statins, and the ratio of that when administered alone to that when coadministered with statins (a) and the same for plasma concentrations of statins (b). The dose of pemafibrate was 0.2 mg twice daily, and those of statins were once daily at the dose of 4 mg for pitavastatin; 20 mg for atorvastatin, rosuvastatin, pravastatin, and simvastatin; and 60 mg for fluvastatin. Data are presented as geometric mean (coefficient of variation) for C max and AUC0‐τ and as the ratio of geometric means [90% confidence interval]. The units of C max and AUC0‐τ are ng/mL and ng∙h/mL, respectively. † n = 18; ‡Calculated for reference purposes only because of statistically significant carry‐over effect (p = 0.0225). C max, maximum plasma concentration; AUC0‐τ, area under the curve within the dosing interval (τ) at steady state.
