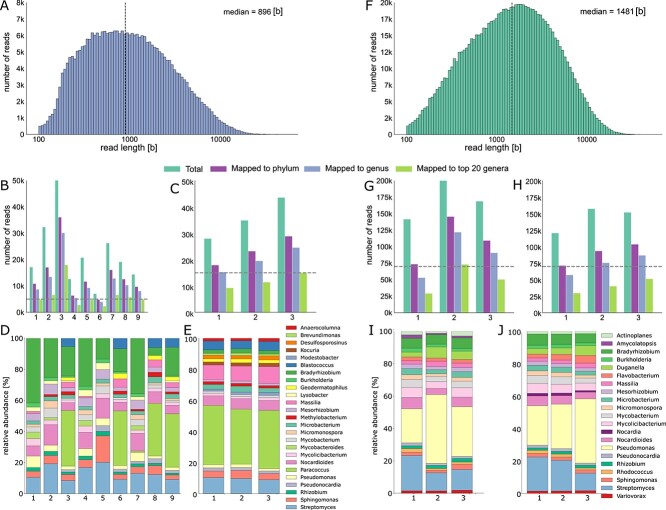
Figure 1.
Robust air microbiome assessments of a controlled (left; A-E) and natural (right; F-J) environment through nanopore shotgun sequencing. A. Nanopore sequencing read length distribution across 1 h- and 3-Gh samples. B-C. Number of total sequencing reads, and of reads mapping to taxonomic phylum and genus level as well as to the 20 most dominant genera using Kraken2 (material and methods) across the samples; the downsampling threshold across samples is indicated by the dashed horizontal line. Taxonomic composition of the D. 1 h- and E. 3 h-samples after downsampling based on the 20 most dominant genera across samples. F. Nanopore sequencing read length distribution across 3 h- and 6 h-Nat samples. G-H. Number of total sequencing reads, and of reads mapping to taxonomic phylum and genus level as well as to the 20 most dominant genera using Kraken2 across the samples; the downsampling threshold across samples is indicated by the dashed horizontal line. Taxonomic composition of the I. 3 h- and J. 6 h-samples after downsampling based on the 20 most dominant genera across samples.

