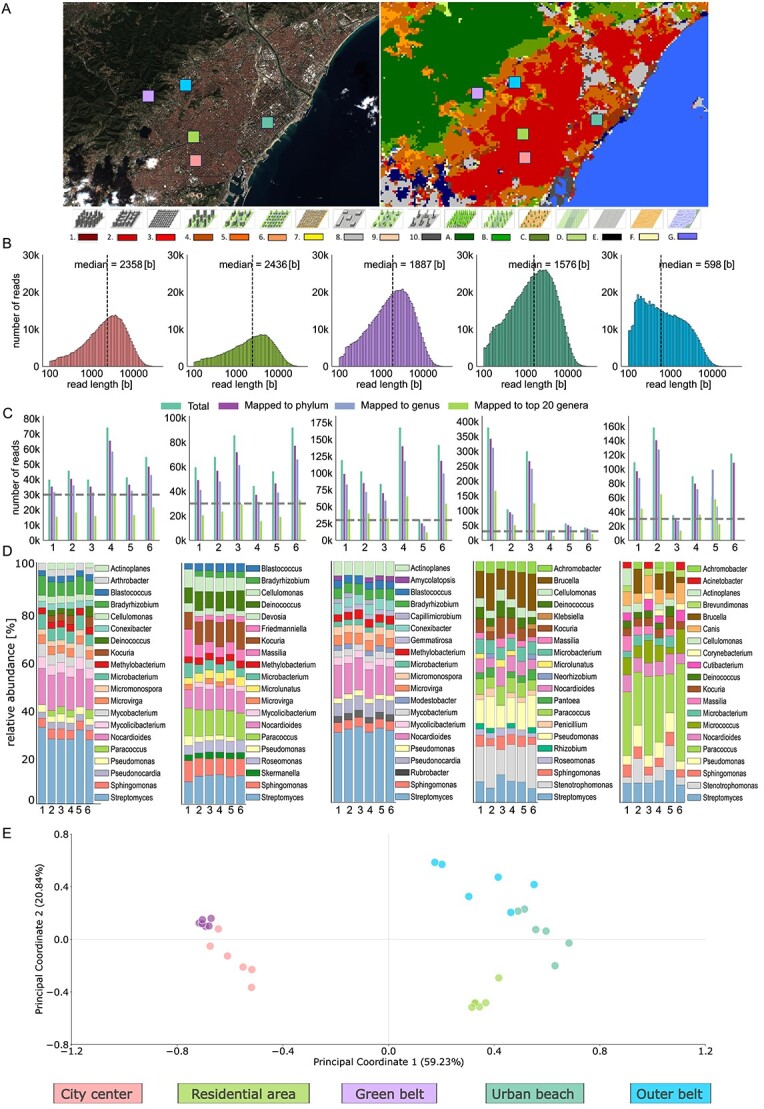
Figure 2.

LCZ classification and metagenomic analysis of Barcelona using satellite images and nanopore shotgun sequencing data. A. Sentinel-2 image and LCZs classification map of Barcelona on 24 October 2023, with a legend of LCZs classes at the bottom. The colored squares indicate the five sampling locations. The legend at the bottom depicts various LCZs represented by 3D models and their corresponding colors. (1-compact high-rise; 2-compact mid-rise; 3-compact low-rise; 4-open high-rise; 5-open mid-rise; 6-open low-rise; 7-lightweight low-rise; 8-large low-rise; 9-sparsely built; 10-heavy industry; A-dense trees; B-scattered trees; C-bush scrub; D-low plants; E-bare rock or paved; F-bare soil or sand; G-water). B. Histograms showing the distribution of read lengths [b] for each sampling site, with the median read length indicated on the top of each histogram. C. Bar plots displaying the number of reads mapped at various taxonomic levels for each sample site, with the downsampling threshold indicated by the dashed horizontal line. D. Relative abundance of the top 20 most abundant bacterial genera at the read level, downsampled to 30 K reads before taxonomic classification using Kraken2. E. PCoA of the relative abundances of the bacterial genera identified at the five sampling locations.
