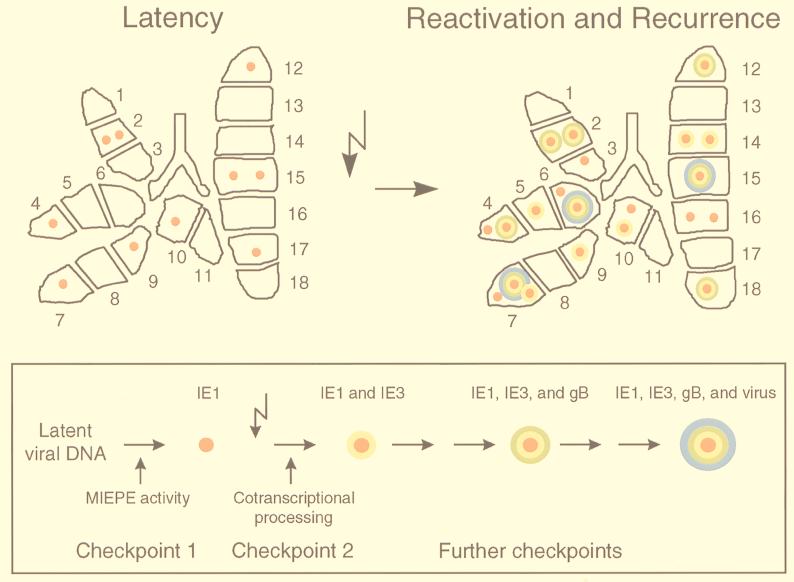
FIG. 6.
Images of focal activities during mCMV latency and reactivation: the orbital model. (Upper left) Prototypic latently infected lung. (Upper right) Prototypic reactivating/recurrently infected lung. Shown are topographical maps of the statistically generated prototypic lungs, with the number and type of foci indicated by symbols illustrating the sequential order of viral gene expression, which is ascending from IE1-specific transcription (red core) via IE3-specific cotranscriptional processing (yellow shell) and gB-specific transcription (green shell) to the production of infectious progeny virions (blue shell). (Box) Orbital model of mCMV reactivation, with sequentially ordered gene expression symbolized by colors that represent increasing “energy.” Checkpoints thought to be involved in the transition from latency to recurrence are indicated. The flash symbol represents the induction by gamma rays.

