. 2024 Jul 29;12(7):e008505. doi: 10.1136/jitc-2023-008505

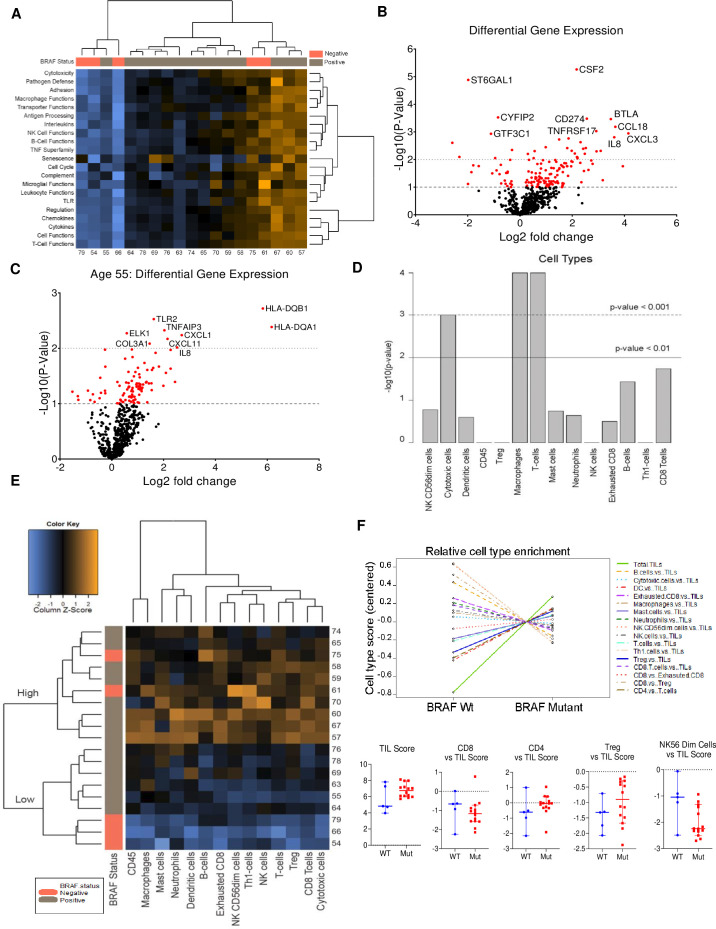
Figure 1. NanoString analysis of the PTC cases from City of Hope (COH). (A) Heat map representing the enrichment of pathways across BRAF-WT and mutated cases. This plot is a high-level overview of pathway scores and also depicts the clustering of samples exhibiting similar score profiles. Orange indicates a high score, and blue indicates low score. (B) Volcano plot representing the differential expression of genes between the BRAF-mutated and WT cases. Red dot represents the gene that showed statistically significant changes p<0.01. (C) Volcano plot representing the differential expression of genes between the BRAF cases with age <55 and ≥55. The red dot represents the gene that showed statistically significant changes p<0.0. (D) The bar plots represent the cell types that are predicted to be enriched in the PTC tumor tissues. (E) Heat map representing the enrichment of cell types across BRAF WT and Mutated cases. (F) CD4 and T-Reg infiltrating TILs are highly enriched in the BRAF-mutated PTC compared with BRAF-WT. PTC, papillary thyroid cancer; TLC, tumor-infiltrating lymphocyte; WT, wild-type.

Figure 1