. 2024 Jul 29;12(7):e008505. doi: 10.1136/jitc-2023-008505

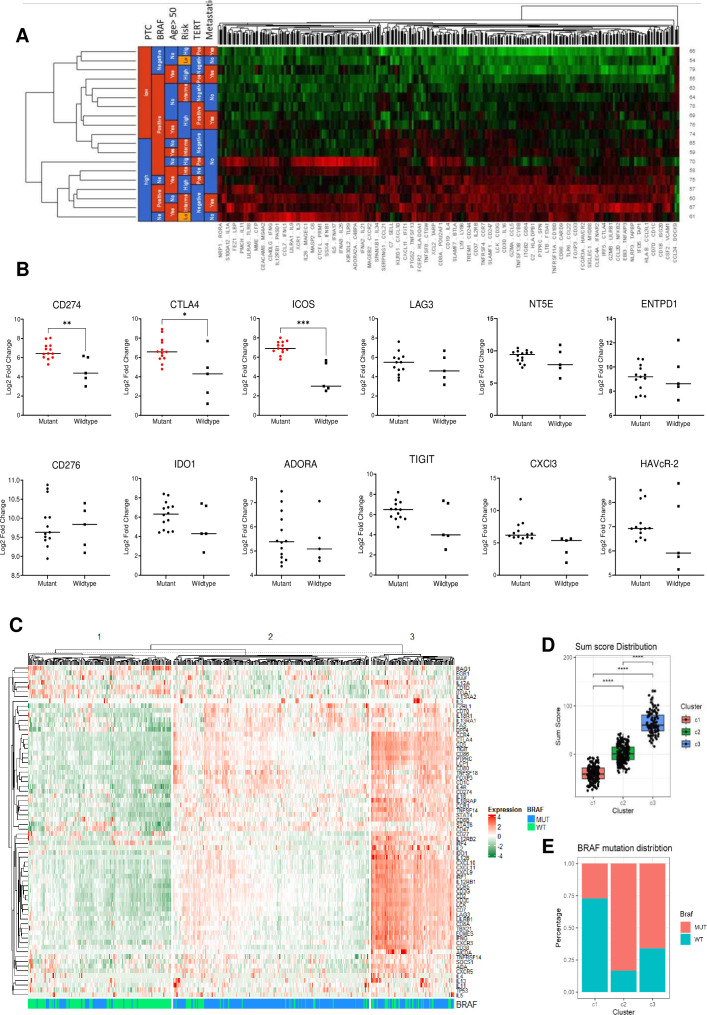
Figure 2. BRAF mutation correlates with immune hot signature. (A) The heatmap represents the expression of all the T cell markers detected in the NanoString data and clustering pattern using BRAF-mutated and WT cases. (B) The graph represents differences in the expression of immunosuppressive markers between the BRAF-mutated and WT cases. (C) The heatmap represents the expression of all the T cell markers detected in the NanoString data across the TCGA thyroid cohort. (D) The box plot represents the sum of scores for the cold (C1), intermediate (C2), and hot clusters (C3). (E) The stacked bar graph represents the distribution of BRAF-mutated cases across all the three clusters. (*p<0.05, **p<0.01, ***p<0.001, ****p<0.0001, ANOVA test). ANOVA, analysis of variance; WT, wild-type.

Figure 2