. 2024 Jul 29;12(7):e008505. doi: 10.1136/jitc-2023-008505

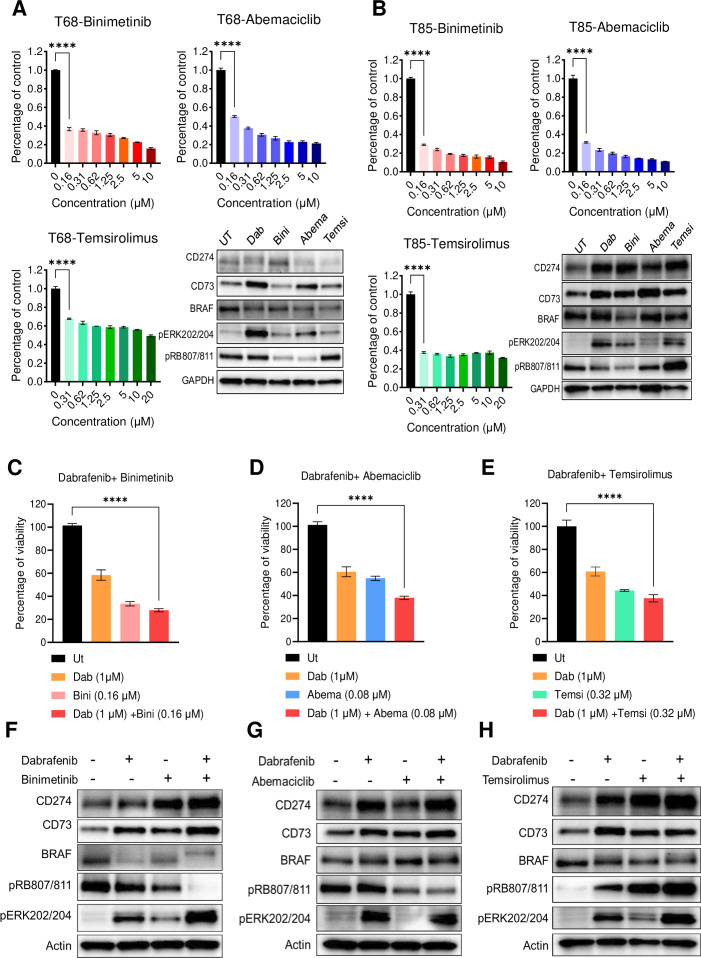
Figure 7. The drug combination effect on CD274 expression. (A, B) The bar graph represents the percentage change in the growth of T68 or T85 cells on binimetinib, abemaciclib or temsirolimus exposure. The immunoblot shows the change in the expression of CD274 and CD73 on drug treatment. (C) The bar graph represents the effect of drug combinations on the cell viability of T85 cells as measured by CCK8 assay. (D–F) The immunoblot represents the increase in the expression of CD274 and CD73 expression on combining dabrafenib with either binimetinib or temsirolimus, or abemaciclib (*****p<0.0001, ANOVA test). ANOVA, analysis of variance.

Figure 7