. 2024 Jul 29;12(7):e008505. doi: 10.1136/jitc-2023-008505

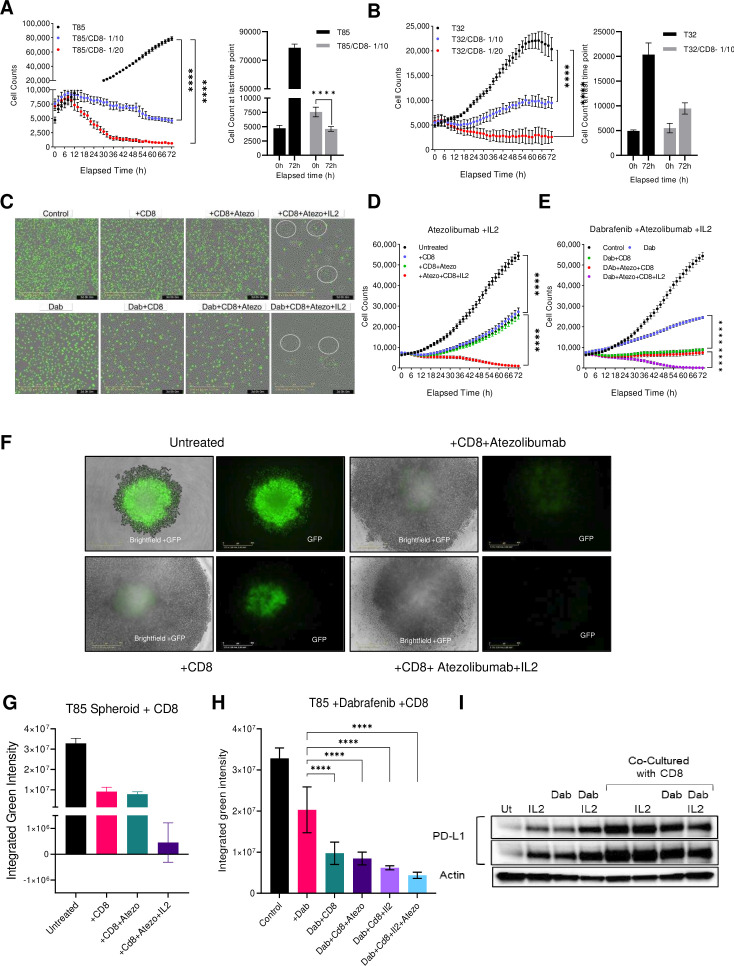
Figure 8. The synergistic effect of BRAF and checkpoint inhibitors in immune cell-mediated killing. (A) The line graph represents the growth kinetics of T85 cells when cultured in combination with activated CD8 cells. The bar graph represents the comparison in growth between monoculture and cocultured T85 cells at 0 and 72 hours time points. (B) The growth kinetics of T32 cells when cultured in combination with activated CD8 cells. (C) The images represent the effect of dabrafenib, CD8, atezolizumab, and IL-2 on the T85 (GFP) cell growth. (D) The growth kinetics of T85 cells when cultured in combination with activated CD8 cells, IL-2, and atezolizumab. (E) The growth kinetics of T85 cells, when cultured in combination with dabrafenib, activated CD8 cells, IL-2 and atezolizumab. (F) The images represent the effect of CD8, atezolizumab, and IL-2 on the T85 (GFP) derived spheroids. Loss of GFP represents a loss of spheroid viability. (G) The bar graph represents the changes in the spheroid viability when cocultured with CD8, IL-2, and atezolizumab. (H) The changes in the spheroid viability when cocultured with dabrafenib, CD8, IL-2, and atezolizumab. (I) The immunoblot represents the changes in the CD274 expression in T85 cells on exposure to IL-2 and dabrafenib n monoculture or coculture. **** indicates P value < 0.001.

Figure 8