. 2024 Jul 29;12(7):e008505. doi: 10.1136/jitc-2023-008505

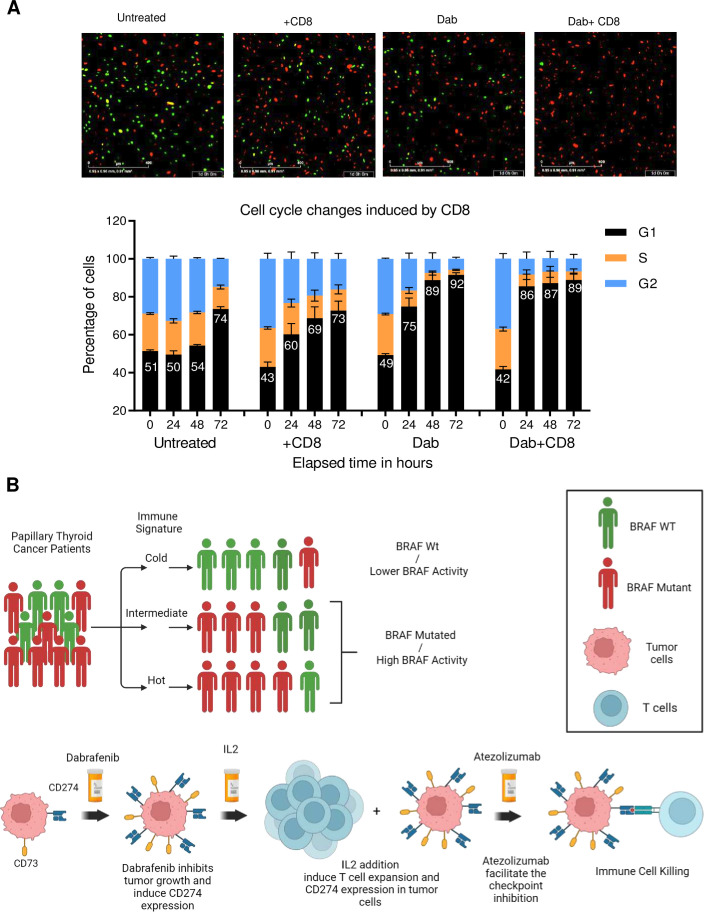
Figure 9. (A) The images represent the distribution of cell cycle G1 (red), S (yellow), and G2 (green) in the untreated cell or cells treated with dabrafenib and cocultured with CD8. The bar graph represents the cell cycle phase distribution in untreated and treated T85 cells. (****p<0.0001, ANOVA test). (B) The cartoon illustrates the diverse patient population and how patients can be stratified and treated to improve the likelihood of favorable outcomes in those with BRAF mutations exhibiting immune hot signatures. The cartoon schematic presented in the manuscript was created using BioRender. ANOVA, analysis of variance; WT, wild-type.

Figure 9