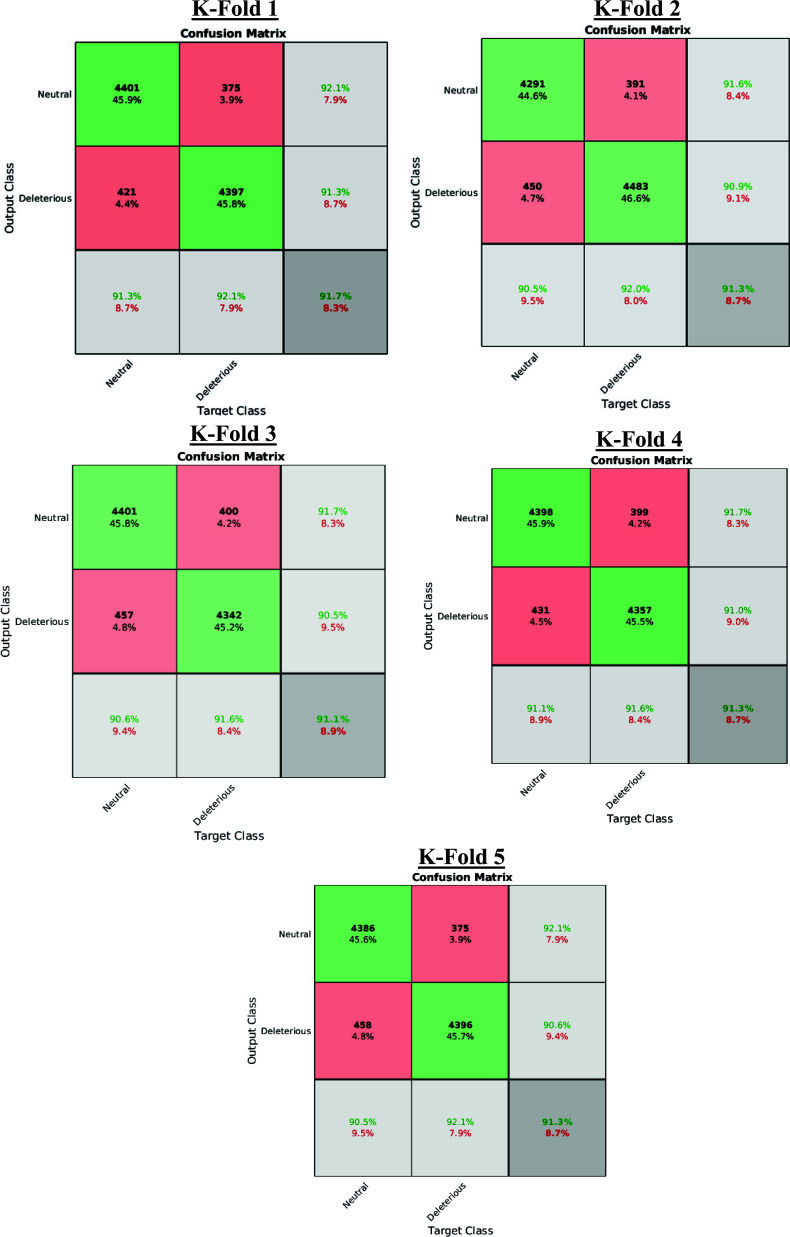
Fig. (6).
Confusion Matrix for each specific K-Fold. In each confusion matrix table, the rows indicate the predicted class via the Holdout Sampler, and the columns correspond to the targeted classes. The diagonal cells (green colour) refer to the observations that are correctly classified, whereas the red diagonal cells in red refer to those that are not properly classified with the Holdout Sampler. Both the number of observations and the percentage of the total number of observations are shown in each cell. The third column represents the percentage of all the examples predicted to belong to each class (properly predicted in green and wrongly predicted in red). This metric is sometimes referred to as precision and false discovery rate. The third row shows the percentages of all the examples belonging to each class that are correctly and incorrectly classified. These parameters are also known as recall and false negative rates. The cell in the bottom right shows the overall accuracy.

