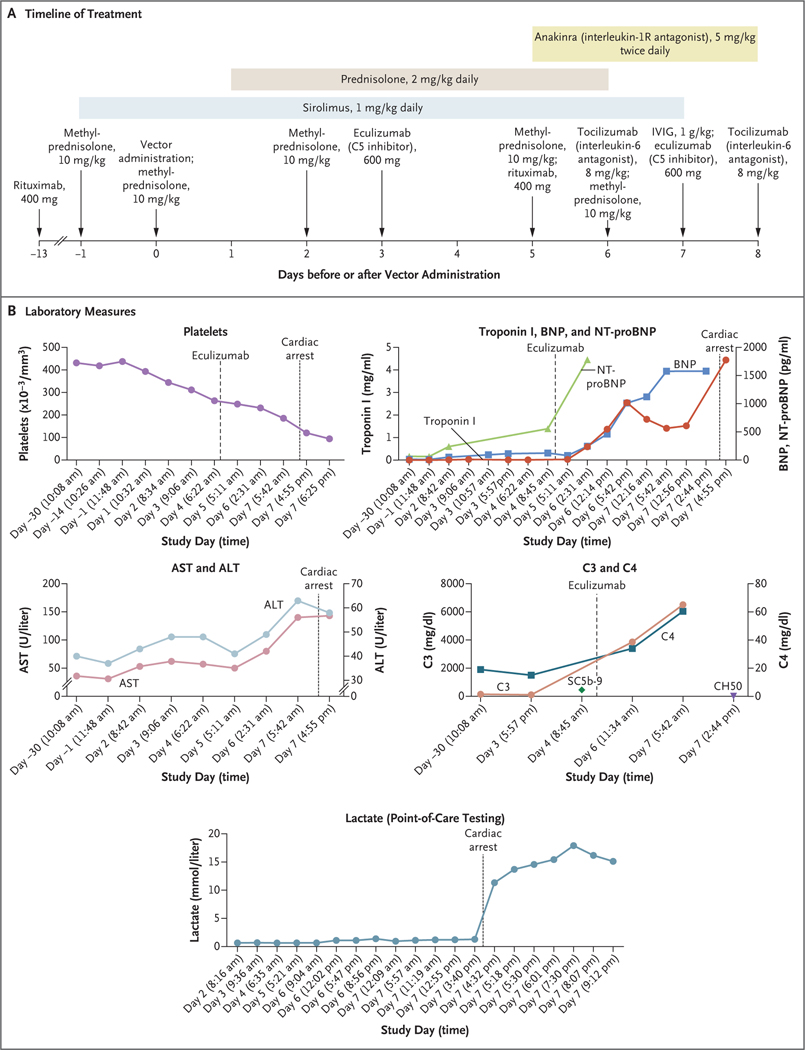
Figure 2. Data from the Clinical Study.
Panel A shows the timeline of treatment administered. IVIG denotes intravenous immune globulin. Days on the timeline indicate days before or after vector administration (which occurred on day 0). Panel B shows cardiac, complement, and liver measures as assessed during the clinical study (beginning 30 days before vector administration). Days on the x axis in each graph in Panel B are based on the individual protocol convention, in which the day of treatment is day 1 rather than day 0. In the graph of C3 and C4, the SC5b-9 level shown is 453 ng per milliliter (normal value, ≤244) and the CH50 level shown is less than 10 U per milliliter (normal range, 31 to 60). Additional laboratory results from the periods before and after gene therapy are shown in Table S3. ALT denotes alanine aminotransferase, AST aspartate aminotransferase, BNP B-type natriuretic peptide, and NT-proBNP N-terminal pro-BNP.

