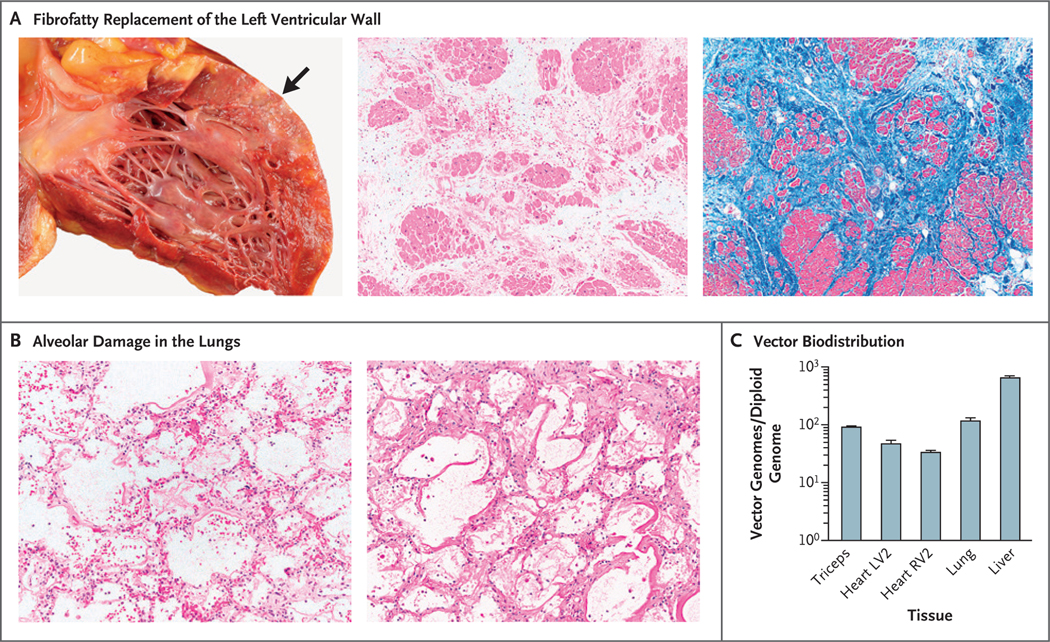
Figure 3. Postmortem Analysis of Tissue.

Panel A shows fibrofatty replacement of the left ventricular wall (arrow) in the patient’s heart. Histologic evaluation of this area shows marked interstitial fibrosis and fatty replacement with residual cardiac myocytes; there is no histologic evidence of myocarditis or thrombotic microangiopathy (hematoxylin–eosin and Masson’s trichrome staining). The findings are consistent with severe cardiomyopathy. Panel B shows a microscopic image of diffuse alveolar damage in the patient’s lungs, characterized by hyaline membrane deposition with interstitial and intraalveolar edema (hematoxylin–eosin and periodic acid–Schiff staining). The images in Panel B are shown at 2.5 times the magnification of the middle and right images in Panel A. Panel C shows vector biodistribution in patient tissues. Vector genomes were quantified by quantitative polymerase chain reaction and calculated to indicate the number of vector genomes per diploid genome for each tissue. Analyses were performed in technical triplicates; data are reported as means, and T bars indicate the standard deviation. LV2 and RV2 are specific sites within the left and right ventricles, respectively.
