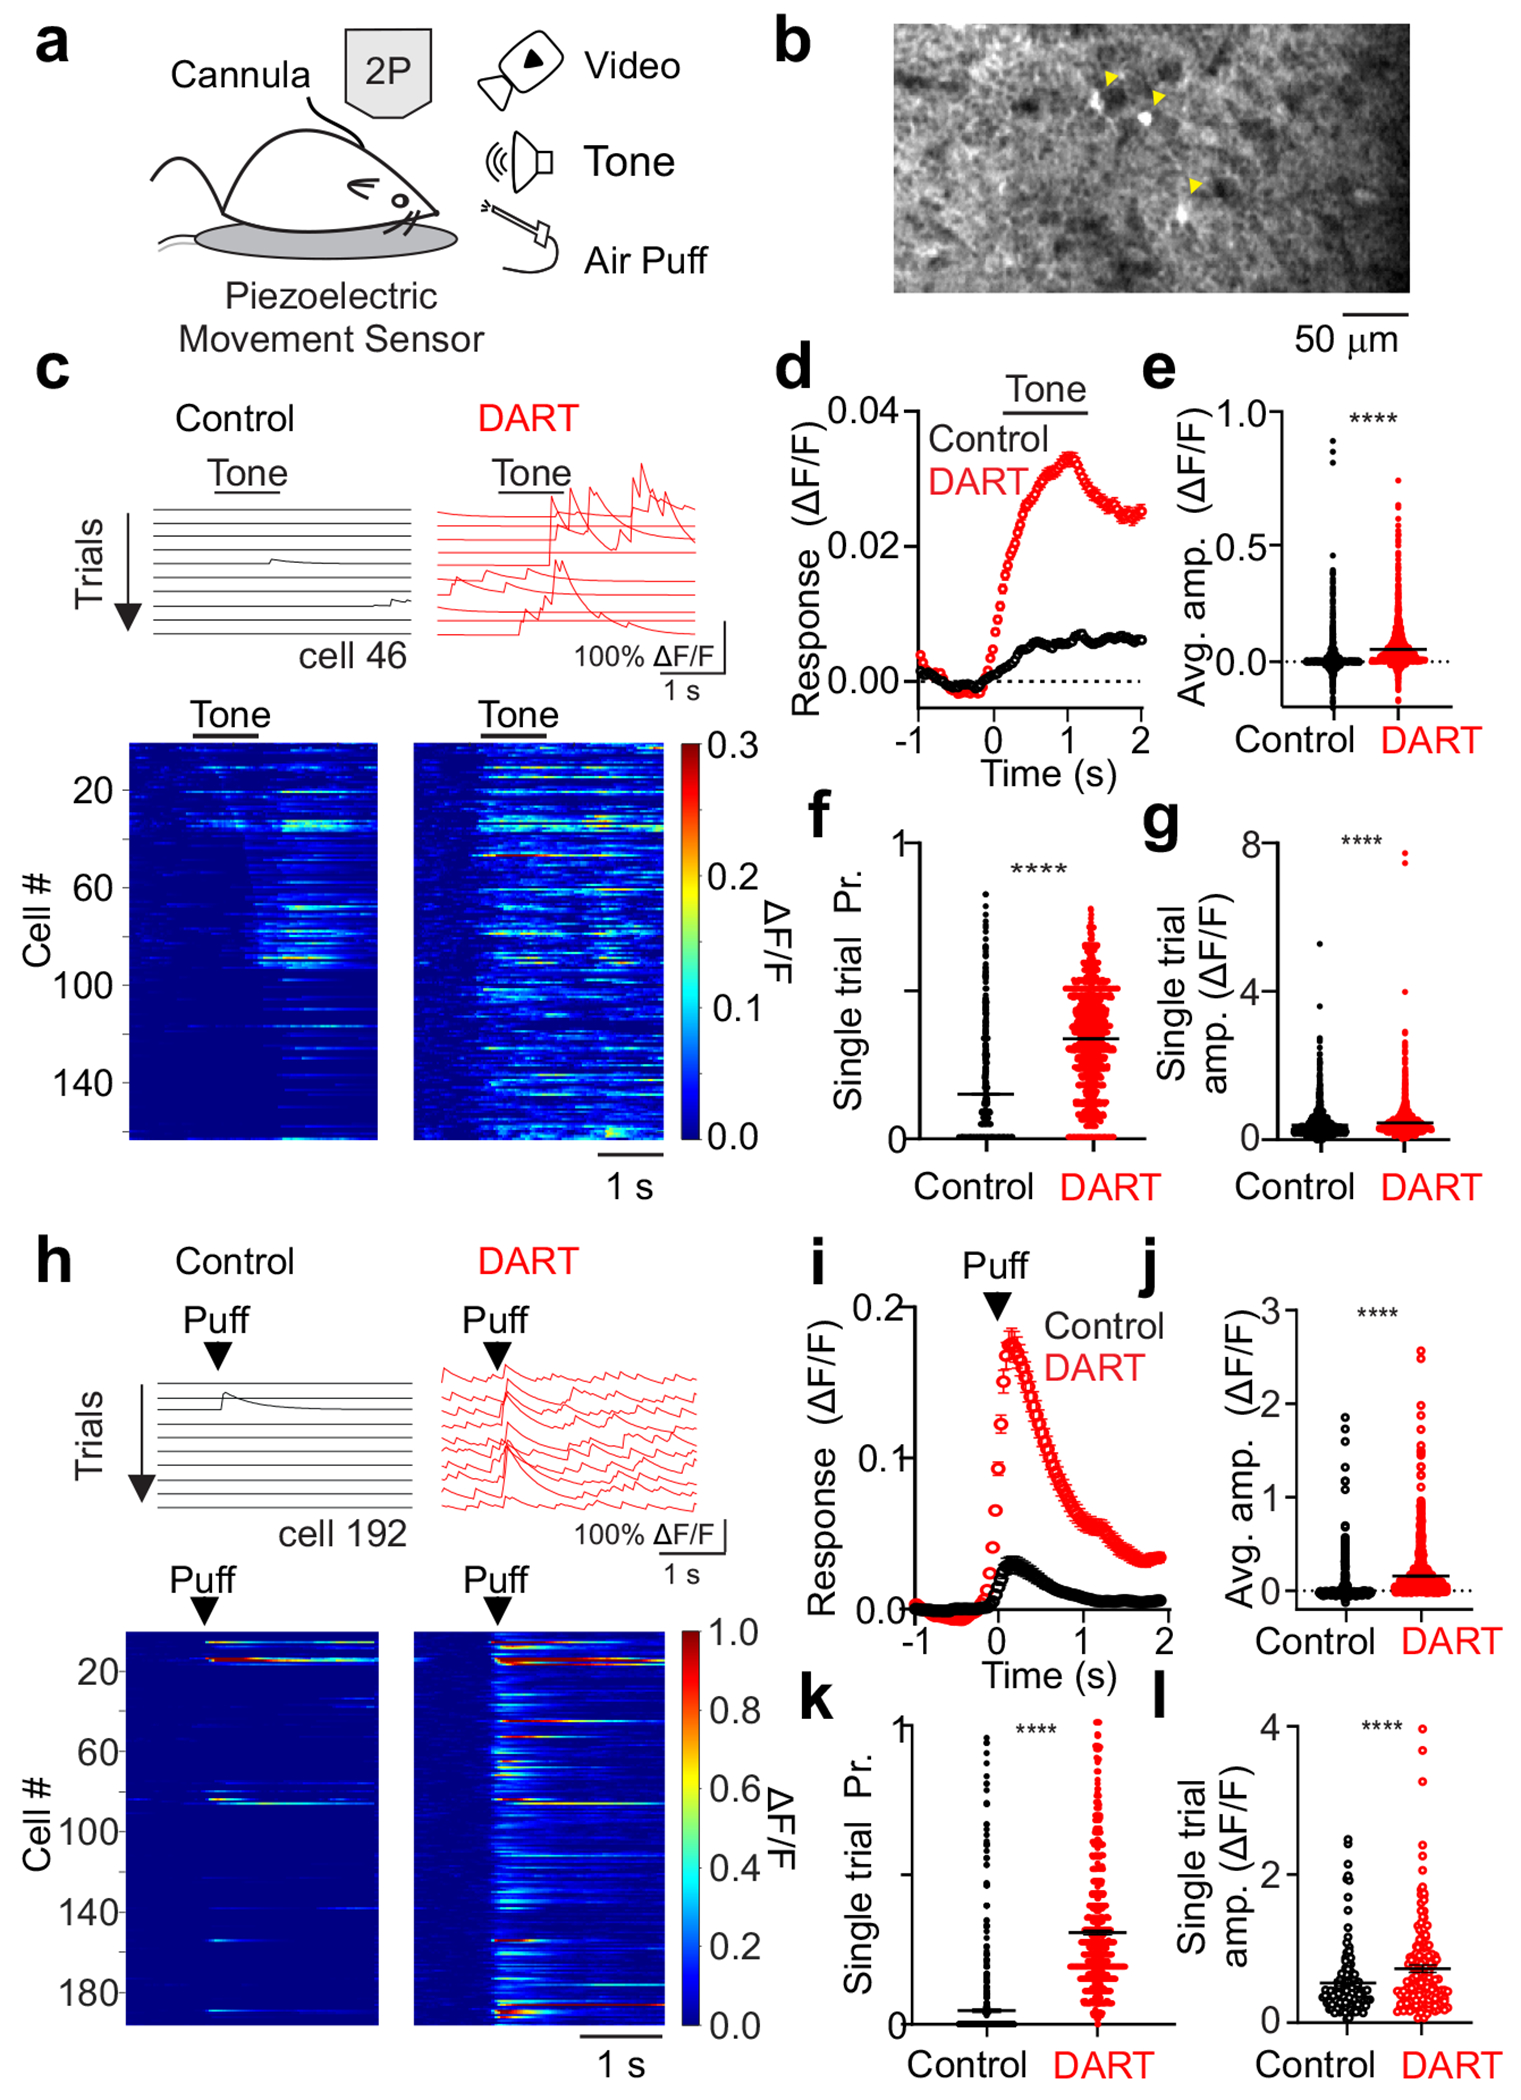
Figure 1. Local synaptic inhibition sparsens and thresholds cerebellar granule cell sensory responses.

a. Schematic of experimental approach. b. Example average field of view across trials of granule cells expressing GCaMP6f during presentation of a somatosensory stimulus in the absence of whole-body movement. Yellow arrows designate significantly responsive cells. c. Top, example calcium traces (ΔF/F) from a granule cell on sequential tone presentation trials before (black) and after (red) gabazine.1DART.2 infusion (“DART”, 1 μM). Bottom, mean responses of all cells with significant responses to a tone before (left) and after DART application (right) in an example mouse with granule cell HTP expression. Example cell above is cell 46. d. Mean time course of responses during tone presentation before (black,) and after (red) DART infusion (n = 3360 cells). Error is SEM across cells from 6 mice. e. Mean response amplitudes for individual cells before (black) and after (red) DART infusion. Black lines are mean ± SEM across cells. f. Same as e, for response probability. g. Same as e, for mean responses on all trials with significant responses (n = 1942 cells). h-l. Same as c-g, for responses to somatosensory stimuli from 6 mice (i-k, n = 815 cells, l, n = 315 cells). Example cell in h is cell 192 in the heatmap. ****p<0.0001, paired t-test (e-g, j-l).
