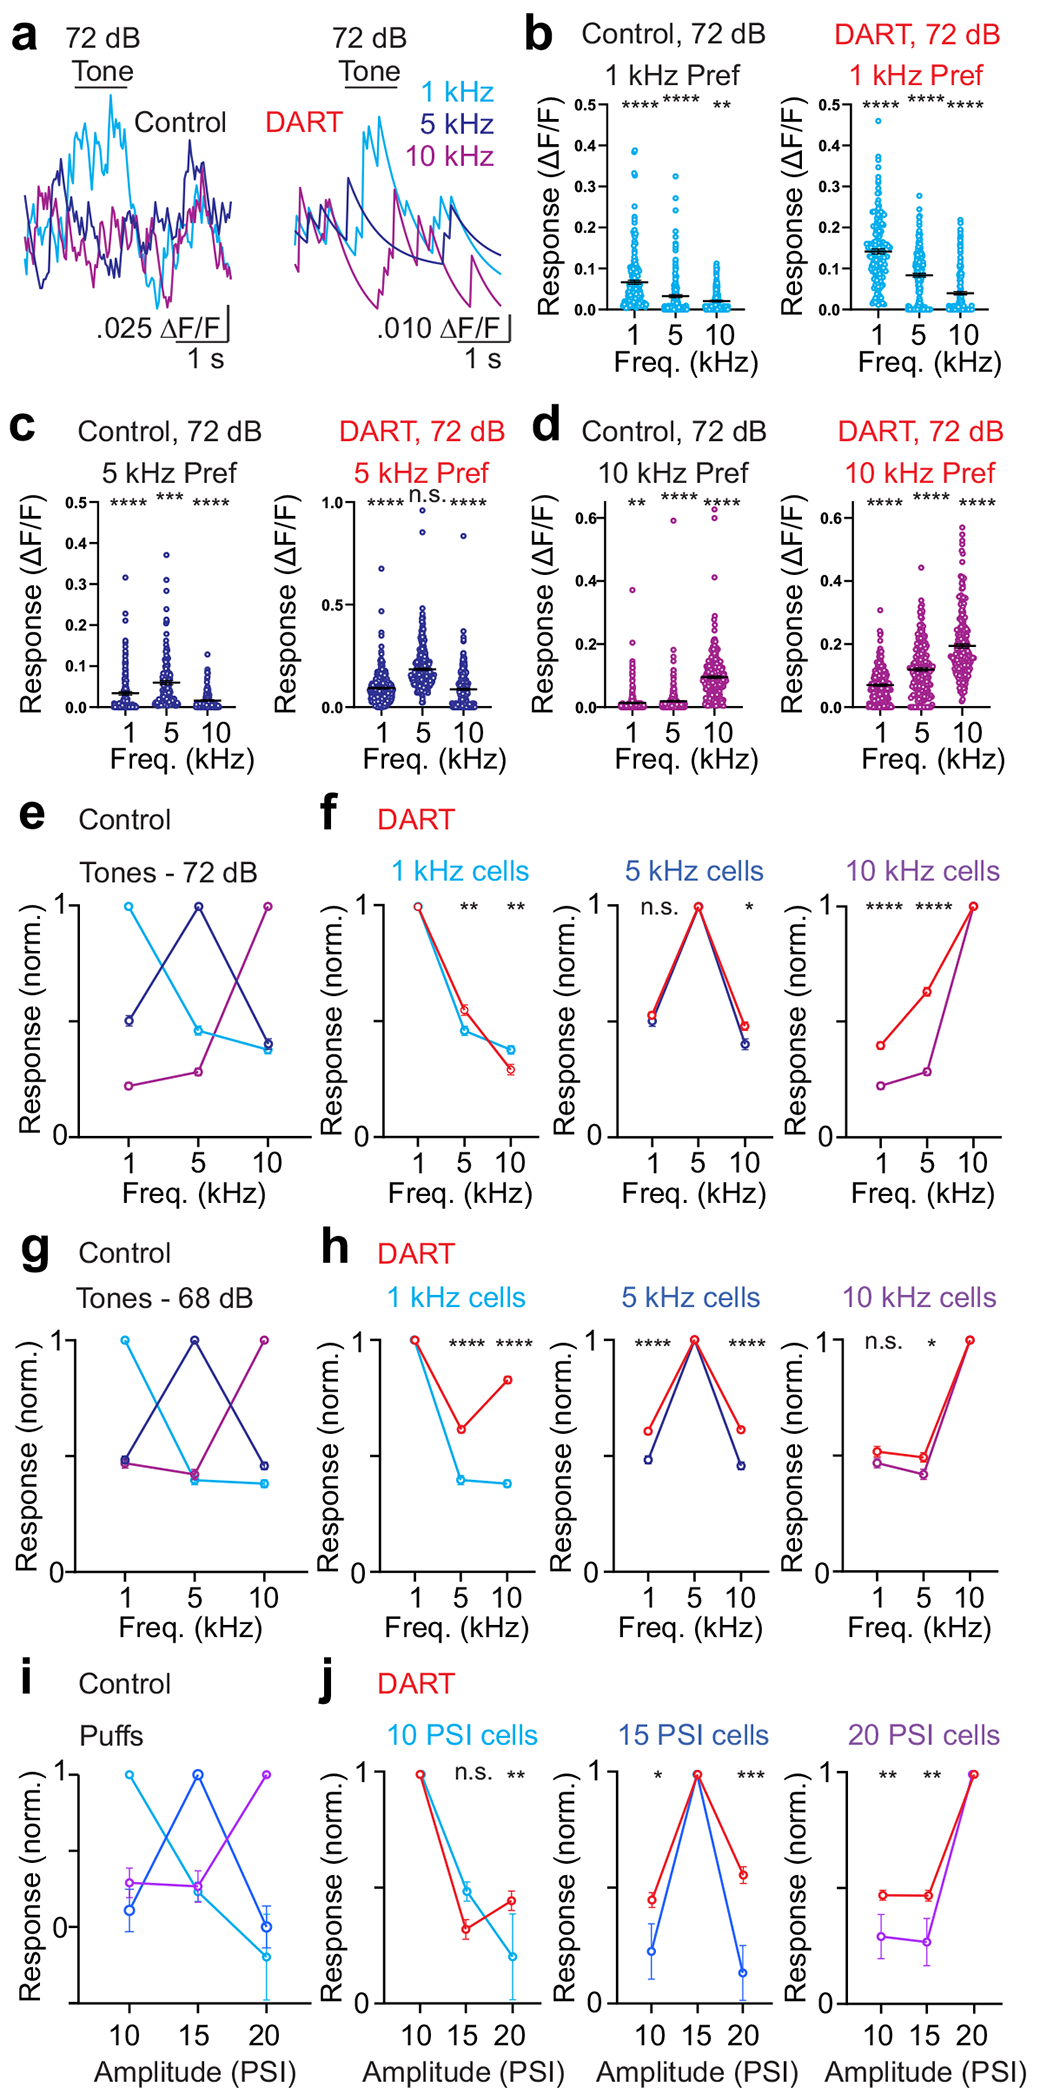
Figure 3. Cerebellar granule cells exhibit stimulus feature preferences that are not abolished by blocking synaptic inhibition.

a. Average change in fluorescence (ΔF/F) for an example cell in response to pure tones at 1 kHz (light blue), 5 kHz (dark blue), and 10 kHz (magenta). Note that the cell responds preferentially to a 1 kHz tone before (left) and after (right) DART infusion. b. Maximum responses for cells significantly responsive to 72 dB tones that prefer 1 kHz. Error is SEM across cells (control: n = 184 cells, DART: n = 170 cells; n = 3 mice). c. Same as b, for cells preferring 5 kHz (control: n = 141 cells, DART = 331 cells). d. Same as b, for cells preferring 10 kHz (control: n = 313, DART: n = 224). e. Normalized responses in control conditions for all granule cells responsive to 72 dB tones, grouped according to the frequency that drove the maximum response: 1 kHz: n = 184 cells; 5 kHz: n = 141 cells; 10 kHz: n = 313 cells; n = 3 mice. Error is SEM across cells. f. Same as e, for tone-responsive granule cells before and after DART infusion (red): 1 kHz: n = 170 cells; 5 kHz: n = 331 cells; 10 kHz: n = 224 cells. g. Same as e, for granule cells responsive to 68 dB tones preferring: 1 kHz: n = 227 cells; 5 kHz: n = 211 cells; 10 kHz: n = 166 cells; n = 3 mice. h. Same as e, for tone-responsive granule cells before and after DART infusion (red): 1 kHz: n = 250 cells; 5 kHz: n = 297 cells; 10 kHz: n = 169 cells. i. Same as e, for all puff responsive cells preferring: 10 PSI: n = 45 cells; 15 PSI: n = 47 cells; 20 PSI: n = 74 cells; n = 3 mice. j. Same as i, for puff responsive cells before and after DART infusion (red): 10 PSI: n = 100 cells; 15 PSI: n = 69 cells; 20 PSI: n = 202 cells). *p<0.05, **p<0.01, ***p<0.001, ***p<0.0001, one-way ANOVA.
