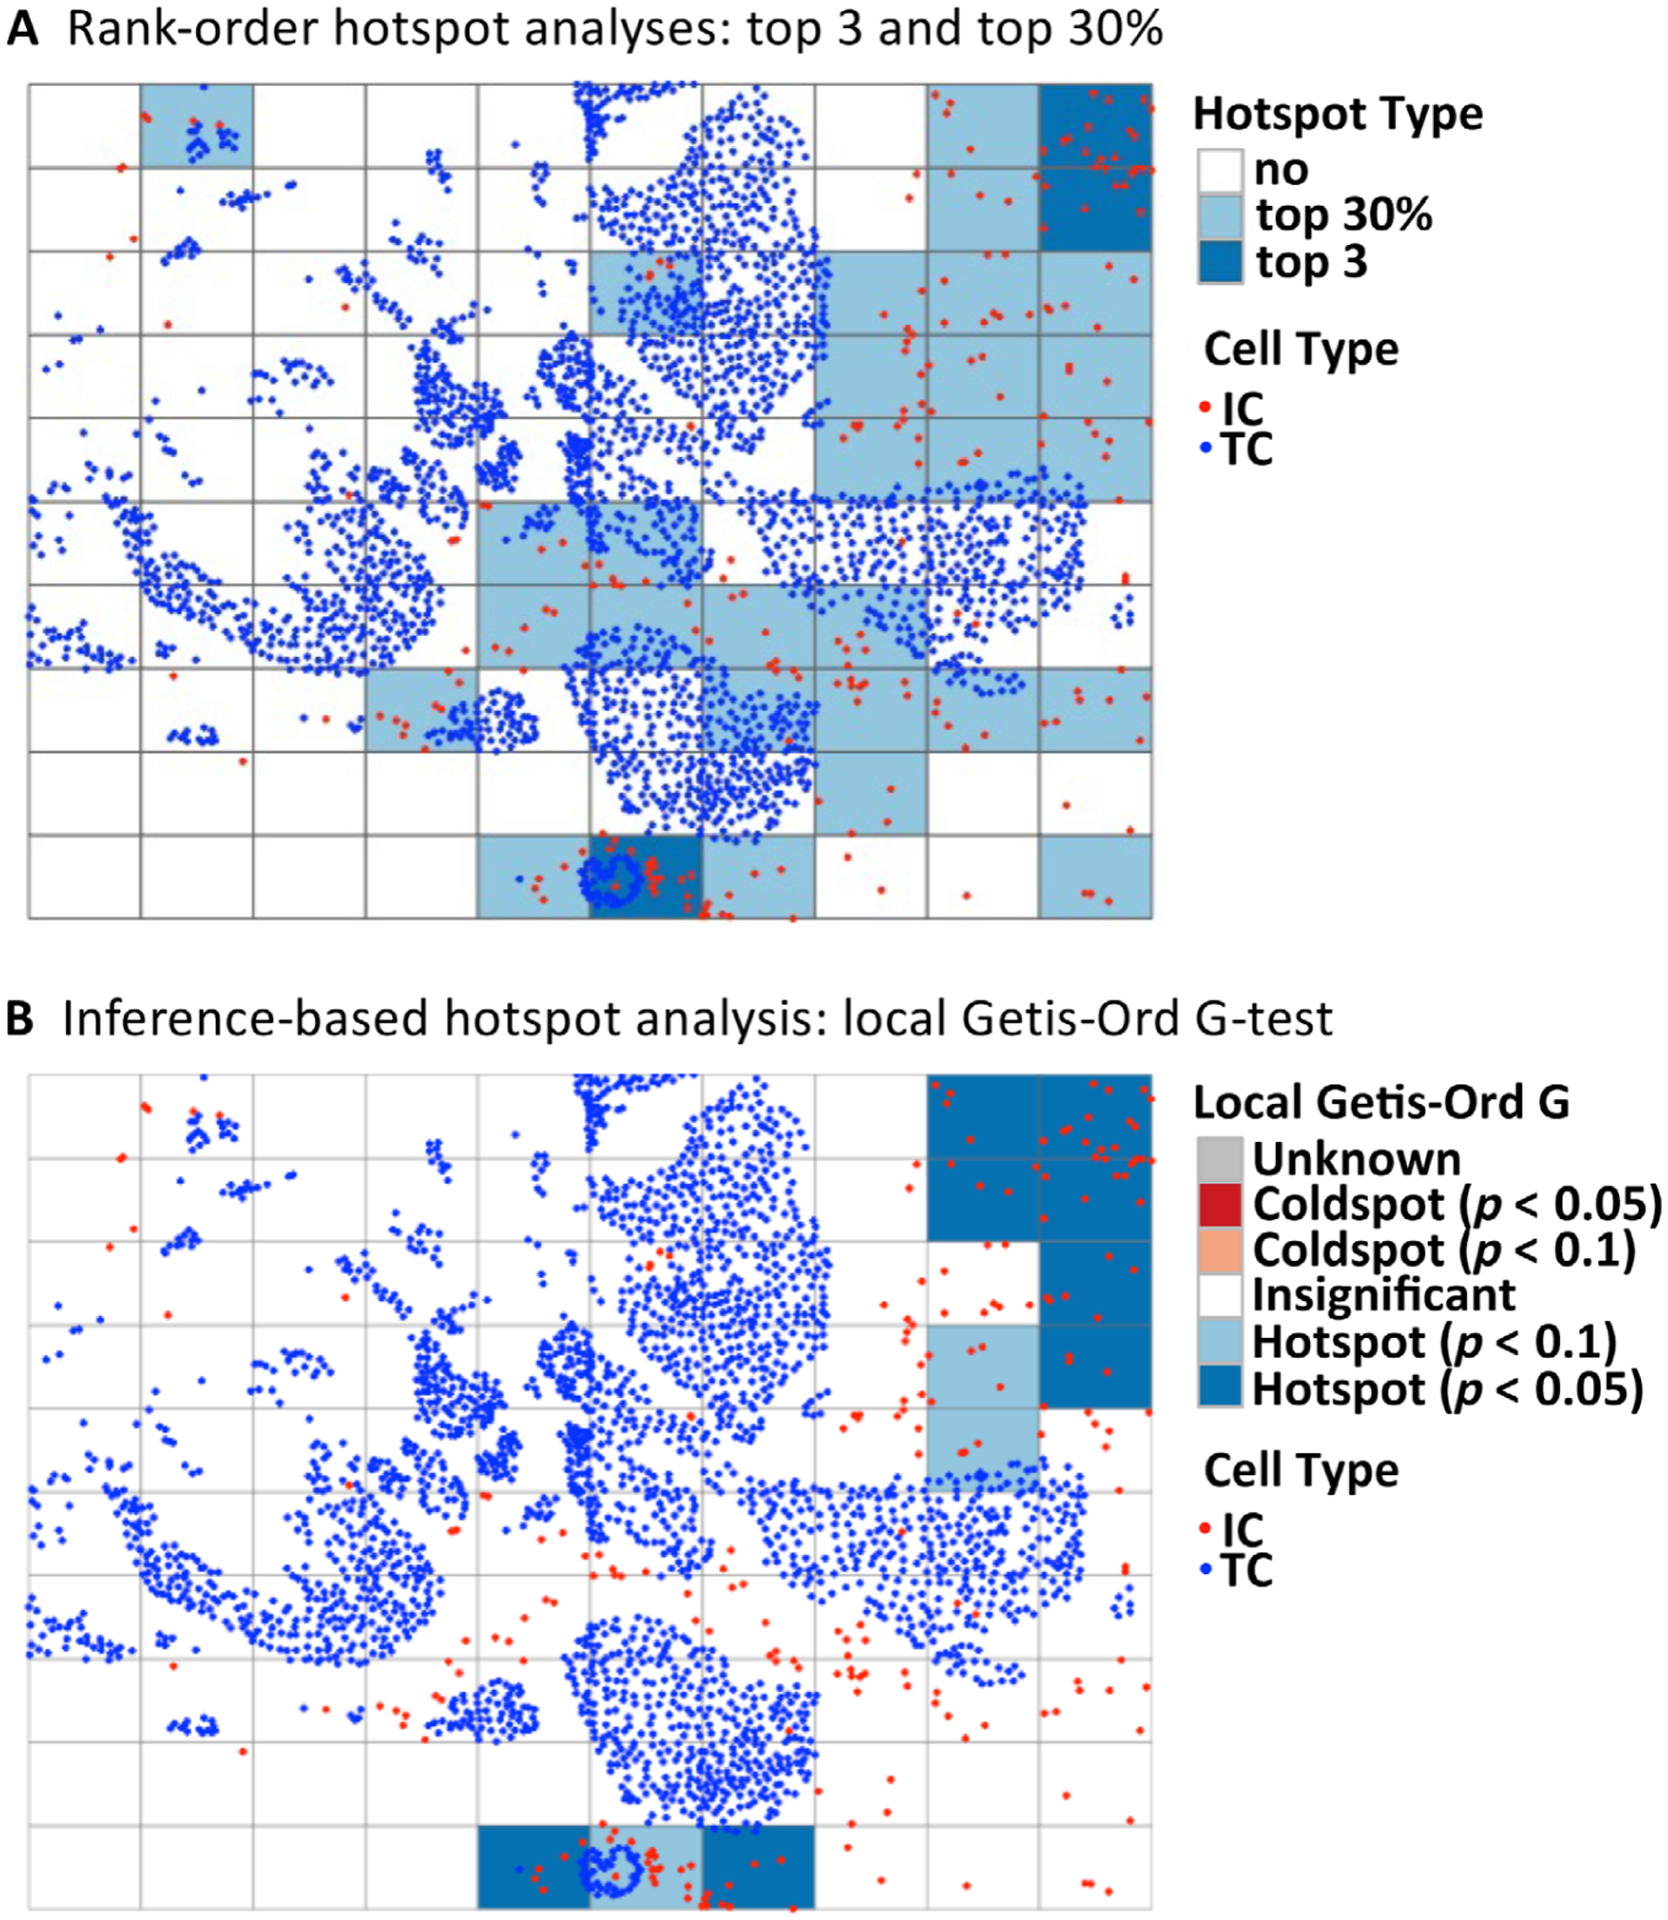
Figure 2.

Illustration of various hotspot metrics. Various methods of calculating IC hotspots have been described in the literature, and include methods based upon rank-ordering of IC density across subregions, or based upon inferential testing. (A) Rank-order-based approaches, which define hotspots as either ‘top 3’ (the three most densely infiltrated subregions) or ‘top 30%’ (the top 30% most densely infiltrated subregions). (B) The Getis-Ord Gi* method, which uses inferential statistical testing to estimate p values indicating the likelihood of each subregion being a hotspot or a coldspot. The Getis-Ord test statistic follows a normal distribution and can be thought of as a measure of local IC density in neighboring subregions, relative to overall IC density. IC, immune cell; TC, tumor cell.
