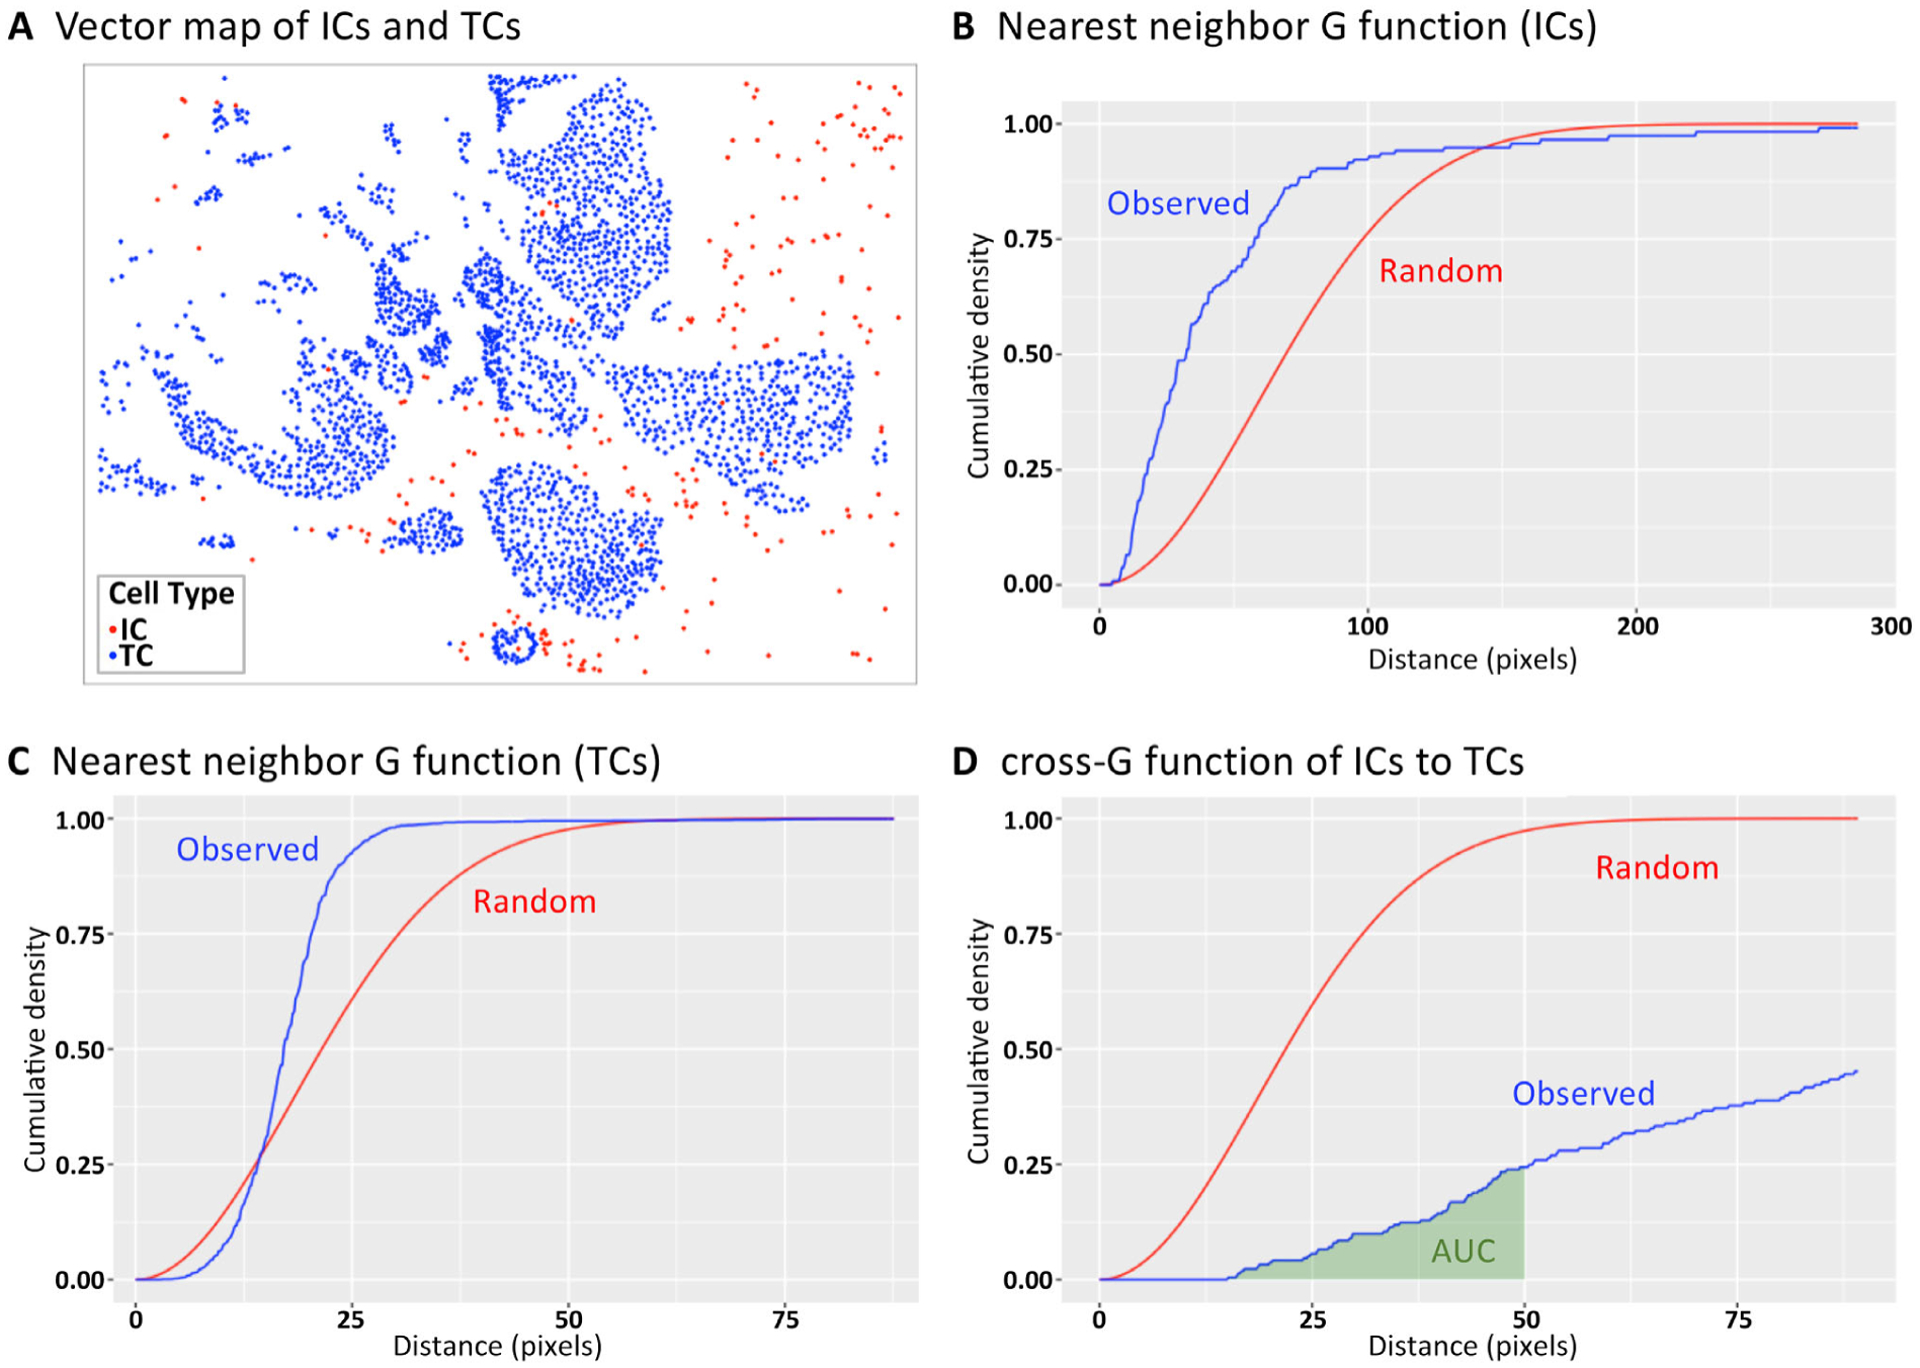
Figure 3.

G and cross-G function for describing cellular colocalization. (A) The (X,Y) locations of ICs in relation to cancer cells of an early-stage breast cancer specimen. Colocalization of cells at specified distances can be illustrated using (B and C) the G function (colocalization of the same cell type) and (D) the cross-G function (colocalization of two distinct cell types). The blue lines illustrate the observed colocalization patterns of the sample, whereas the red lines illustrate the expected colocalization under the assumption of randomness/homogeneous point pattern. In (D), the AUC is illustrated in green and is used to provide a global metric of colocalization of two cell types within a certain proximity range (<50 pixels in this example). TC, tumor cell.
