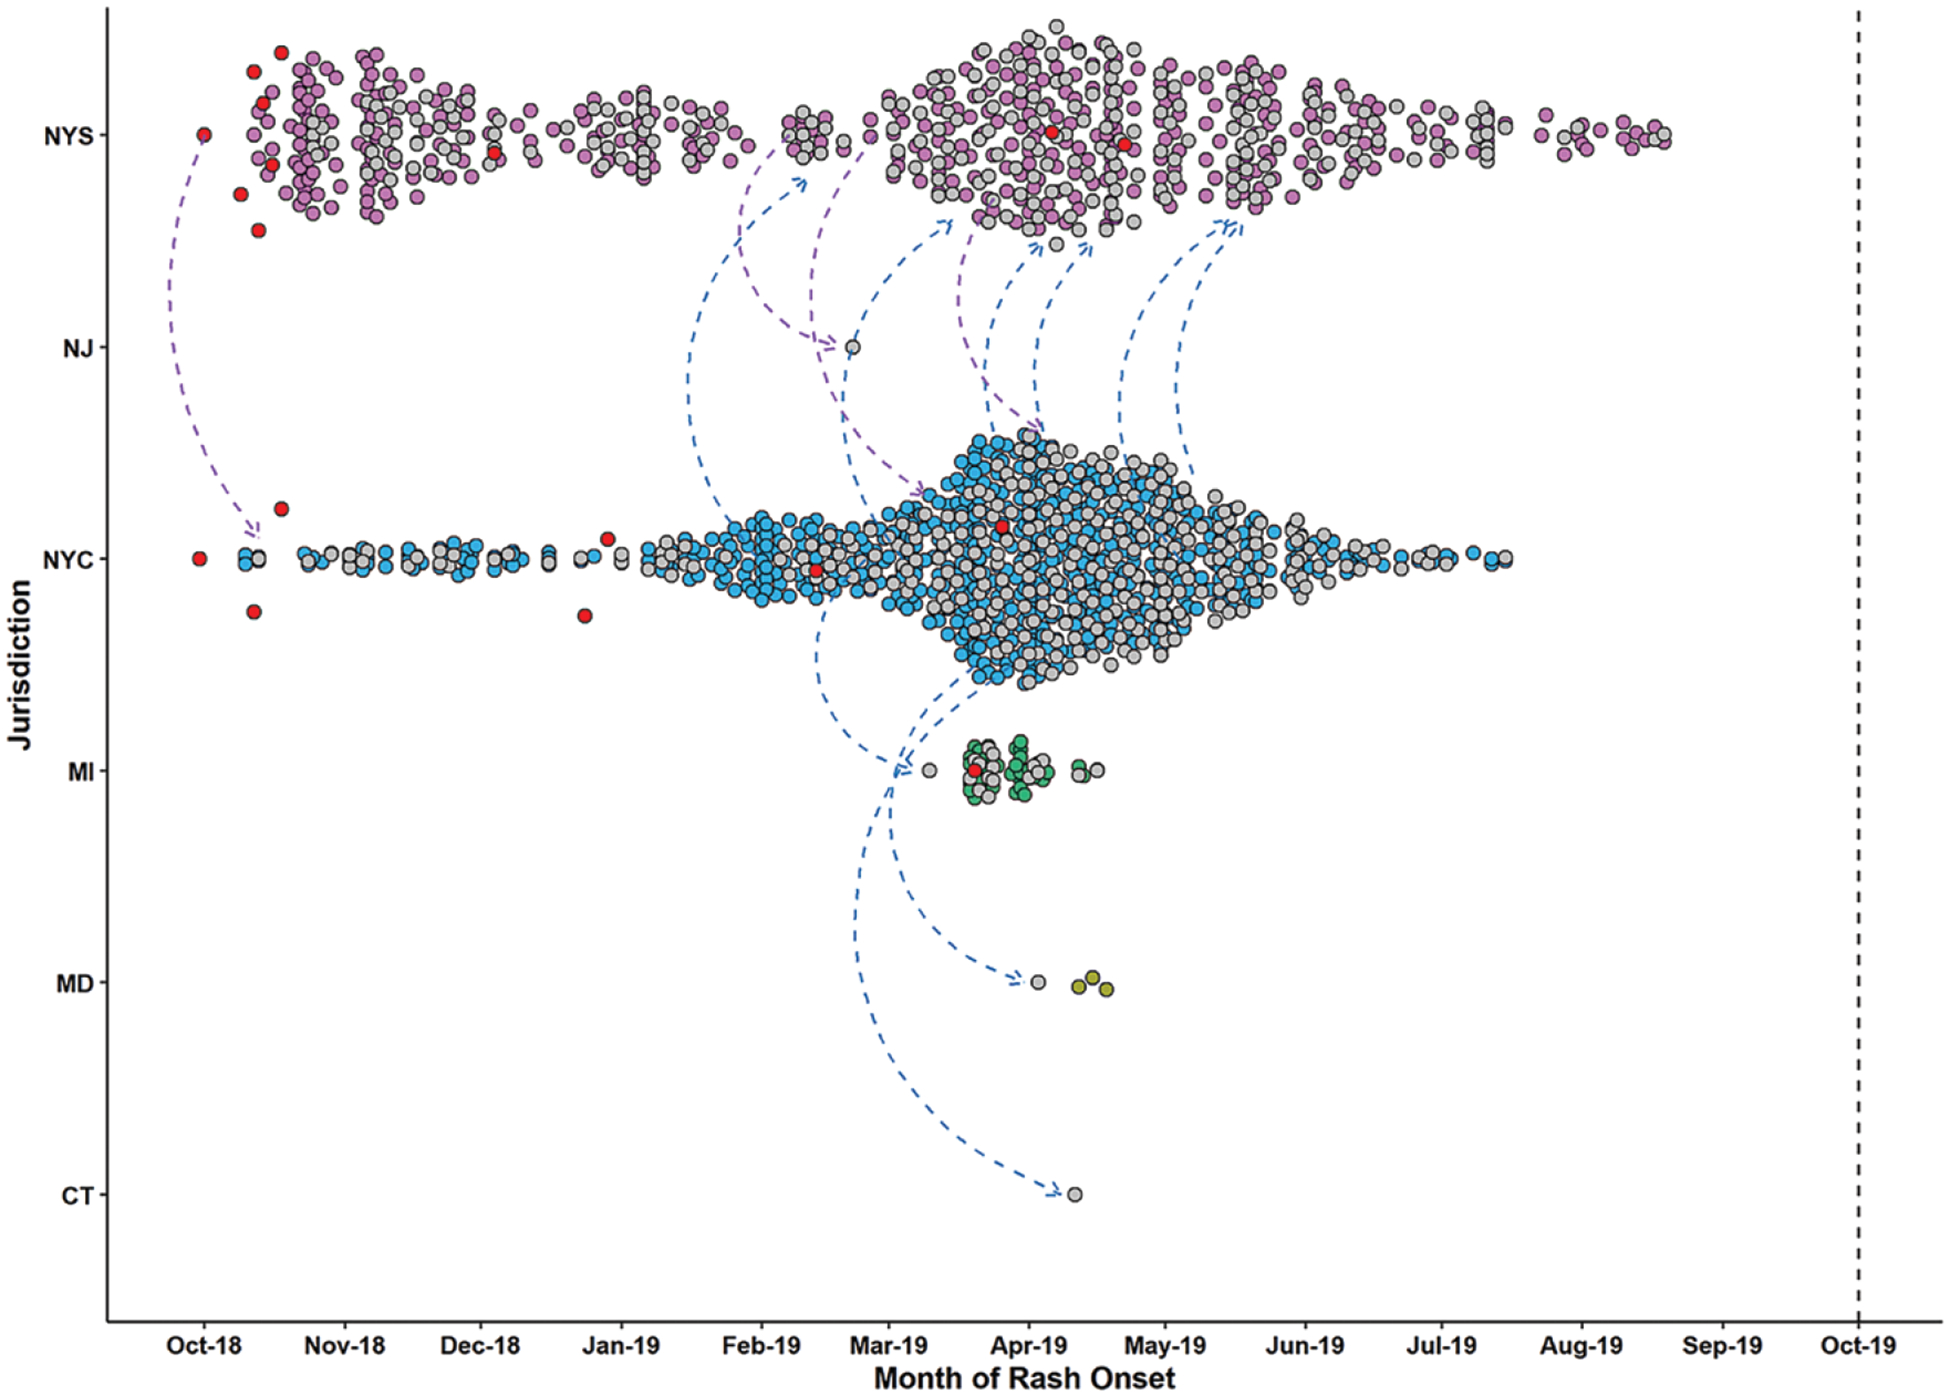
Figure 3.

Measles transmission in the United States during the 2018–2019 New York State (NYS) and New York City (NYC) outbreaks. Included are all cases known to be related to these outbreaks (1105 cases from 6 jurisdictions: New York City [649 cases], New York State [407 cases], Michigan [MI; 42 cases], Maryland [MD; 5 cases], Connecticut [CT; 1 case], and New Jersey [NJ; 1 case]; 2 cases [1 from New York State and 1 from Maryland] are not pictured because they did not have information on the date of rash onset). Each case is represented by a circle and plotted based on the reporting jurisdiction (y-axis) and the rash onset date (x-axis). Cases reported by distinct jurisdictions are shown in separate colors. Internationally imported cases are shown in red (14 from Israel and 1 each from Ukraine, the United Kingdom, United Kingdom/Belgium, and Ukraine/Israel). Gray circles represent cases with an unknown source (ie, cases without a direct epidemiological link to another case); arrows, known or potential exportation of measles from one jurisdiction to another; vertical dashed line, date for 12 months of continuous transmission.
