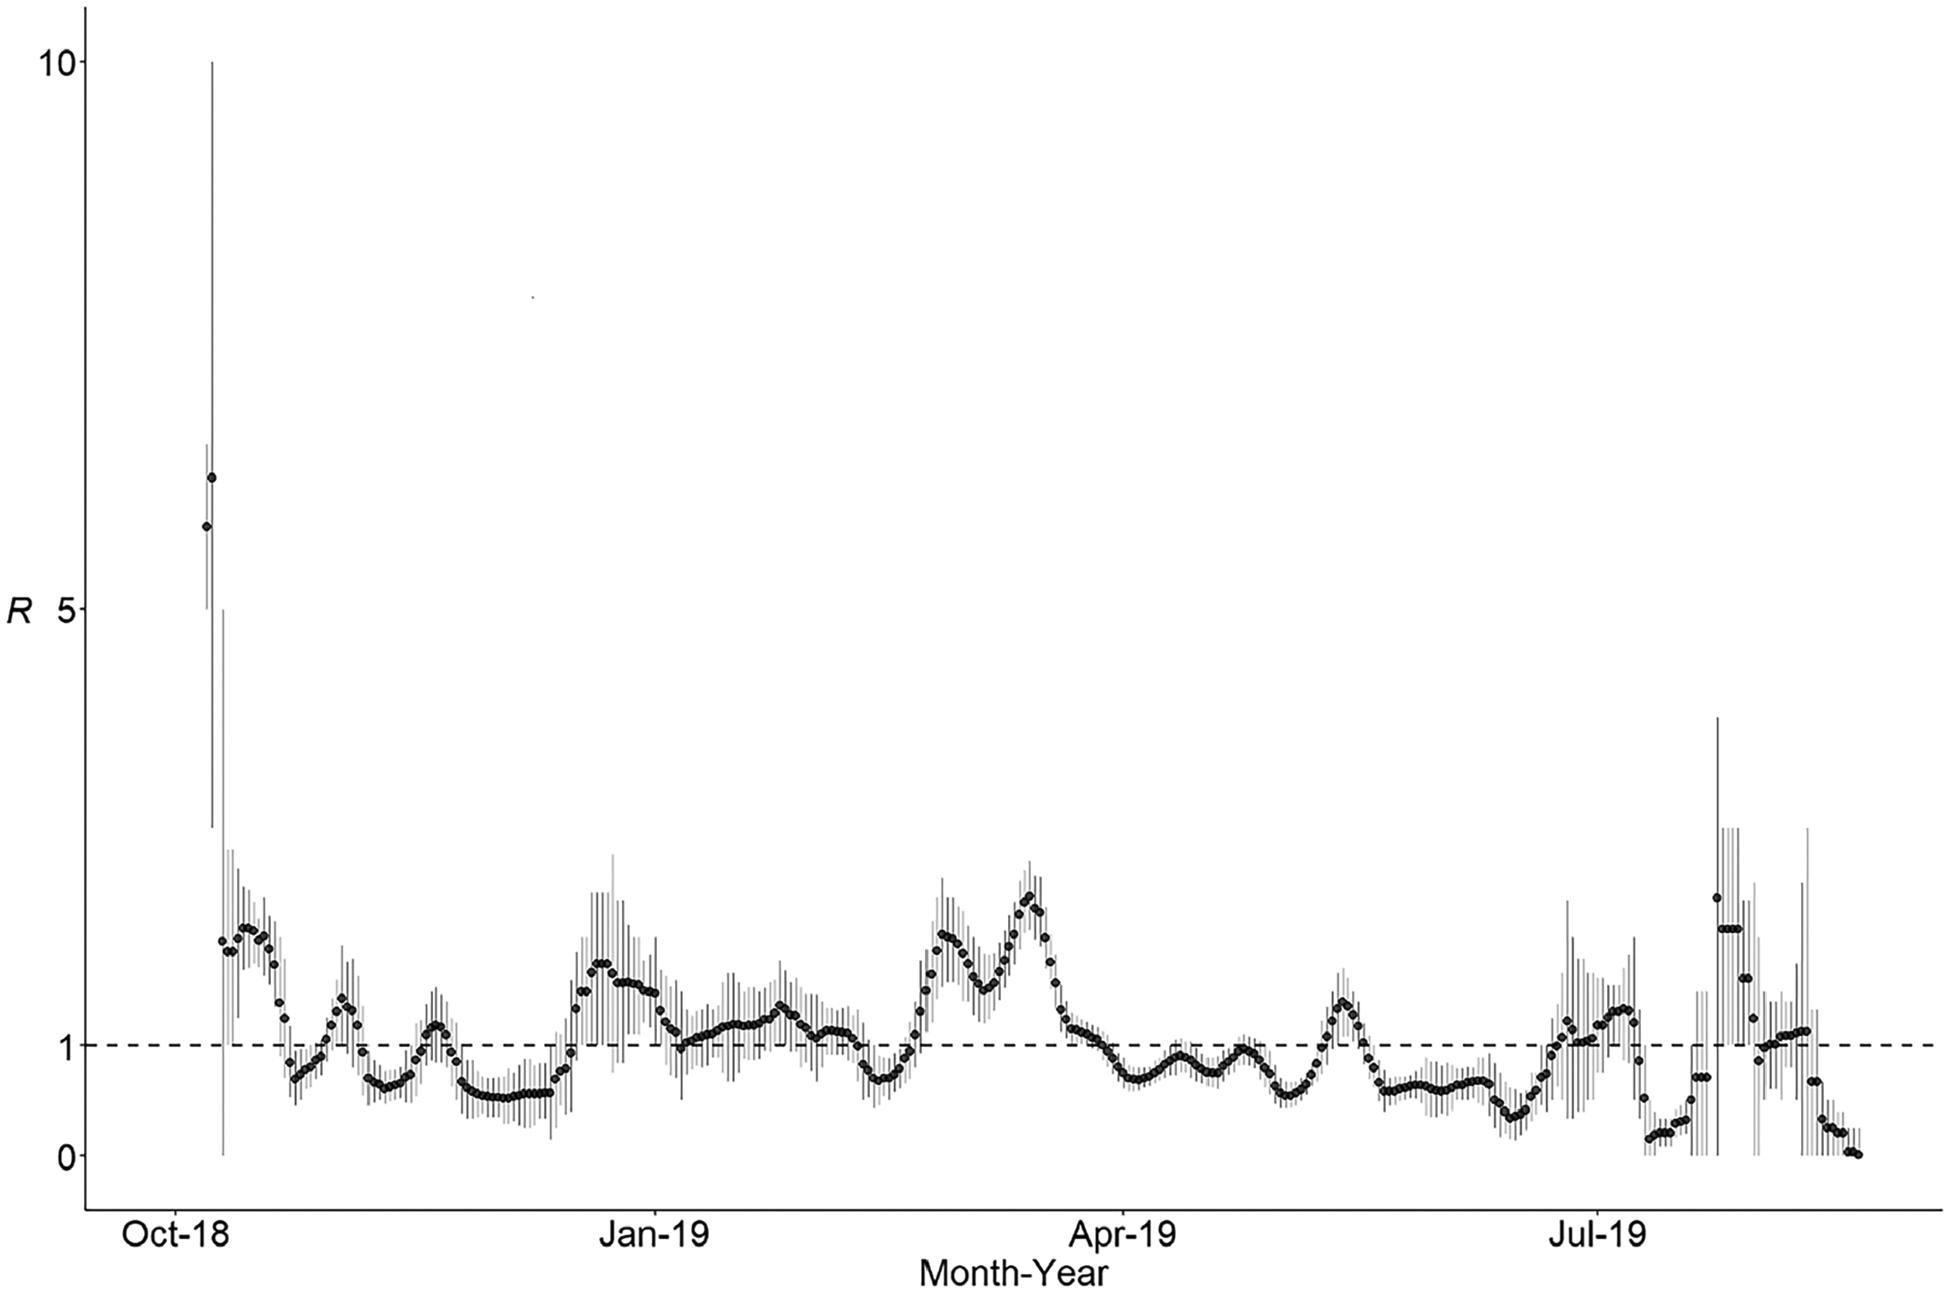
Figure 4.

Daily estimates of the effective reproduction number (R) during the 2018 and 2019 New York outbreaks. Calculations were based on all cases known to be related to these outbreaks; a total of 1105 cases from 6 jurisdictions: New York City (649 cases), New York State (407 cases), Michigan (42 cases), Maryland (5 cases), Connecticut (1 case), and New Jersey (1 case). Two cases (1 from New York State and 1 from Maryland) were not included in this analysis because they did not have information on the date of rash onset. Black circles show the mean estimate; vertical bars, 0.25 and 0.75 quantiles; and horizontal dashed line, the threshold value R = 1 (control of an outbreak is demonstrated by maintenance of R < 1). Estimates are presented over sliding 7-day windows, with the estimates plotted on the last day of the window. Here we accounted for the 18 separate importations associated with these outbreaks in the calculation of R; importations could not be attributed to any of the prior cases but could be the source of any subsequent case.
