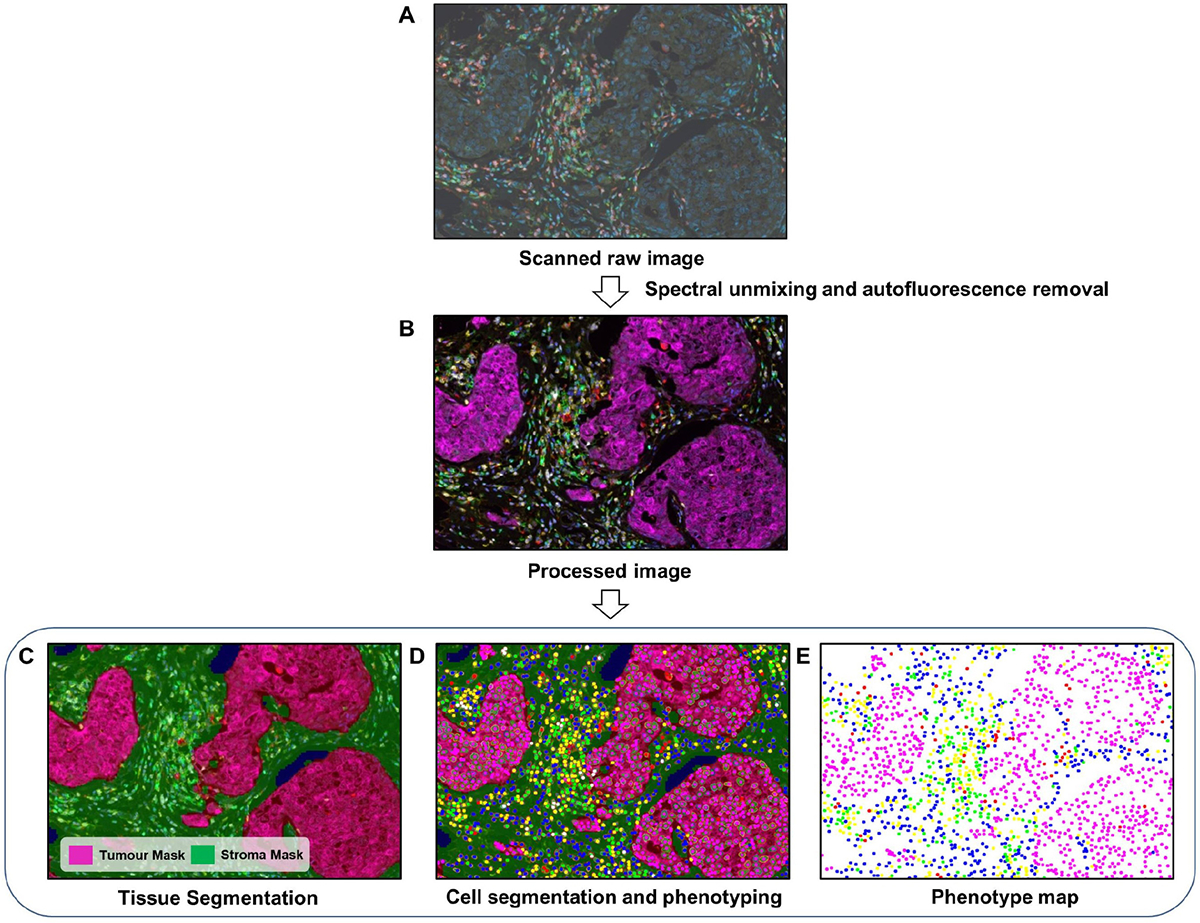
Figure 4.

DIA workflow for mIF. (A) First, raw images are generated by scanning stained tissue slides. (B) Spectral unmixing and autofluorescence removal are performed with the software to extract the true signals from each marker. (C) A tissue segmentation algorithm is run to segment tumour and stromal areas. (D) Cell segmentation followed by cell phenotyping is performed to classify all cells based on the marker panel used. (E) Finally, spatial mapping of all cell classes is carried out for further proximity analysis. The images were generated using inForm® image analysis software, Akoya Bioscience.
