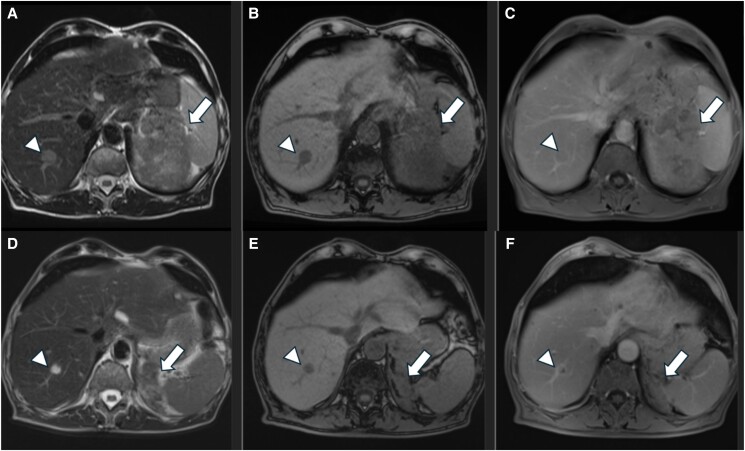
Figure 3.
Pre-and 6 months posttreatment MRI of the same patient. Axial T2W STIR (A), T1-opposed phase (B), and contrast-enhanced T1W SPIR (C) images on pretreatment MRI demonstrate a heterogeneous left adrenal mass (arrow in A and B) with intense contrast enhancement (arrow in C). A hepatic metastasis is also seen in the right liver lobe (arrowheads in A-C). Corresponding posttreatment MRI exhibits a significant decrease in the adrenal lesion size (arrows in D-F). Note the minimal enhancement of the lesion on the postcontrast image (arrow in F), another finding indicative of the tumor's response to treatment. Liver lesion is also decreased (arrowheads in D and E) and less enhanced (arrowhead in F) on posttreatment MRI.
Abbreviations: MRI, magnetic resonance imaging.

