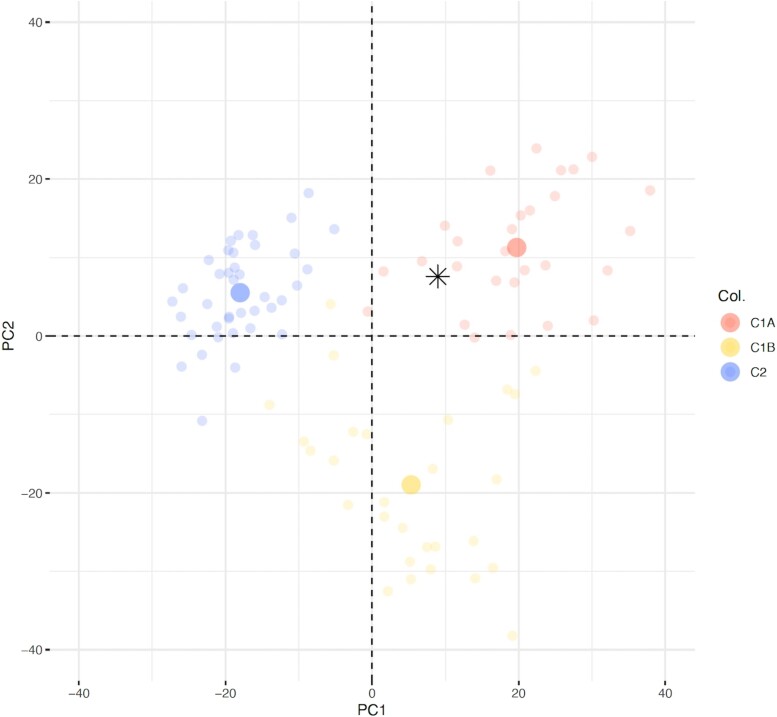
Figure 5.
Transcriptome classification. Patient's sample (*) was projected on the two principle components (Dim1, Dim2) of a principal component analysis (PCA) in a reference cohort of 95 patients (14). Samples from this reference cohort are presented as faint circles colored by transcriptome class: blue for adrenocortical adenomas “C2”, red for adrenocortical carcinoma of poor prognosis “C1A” and yellow for adrenocortical carcinoma of better prognosis “C1B”.

