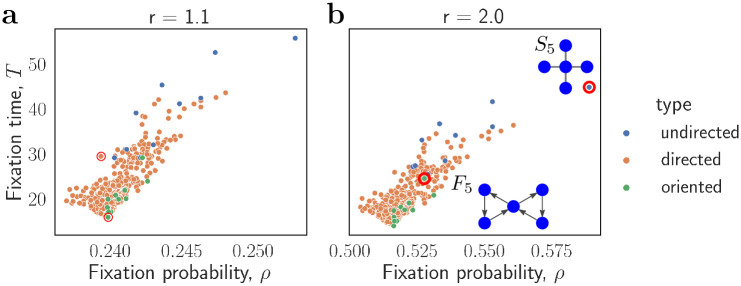
Fig 4.
Fixation time and fixation probability of a single mutant under uniform initialization for all 5048 graphs with N = 5 nodes, for a, r = 1.1 and b, r = 2. Each graph is represented as a colored dot. The undirected graphs (with all edges two-way) are labeled in blue. The oriented graphs (with no edges two-way) are labeled in green. All other directed graphs are labeled in orange. The slowest graph is the (undirected) Star graph S5. Among the oriented graphs, the slowest graph is the Fan graph F5.

