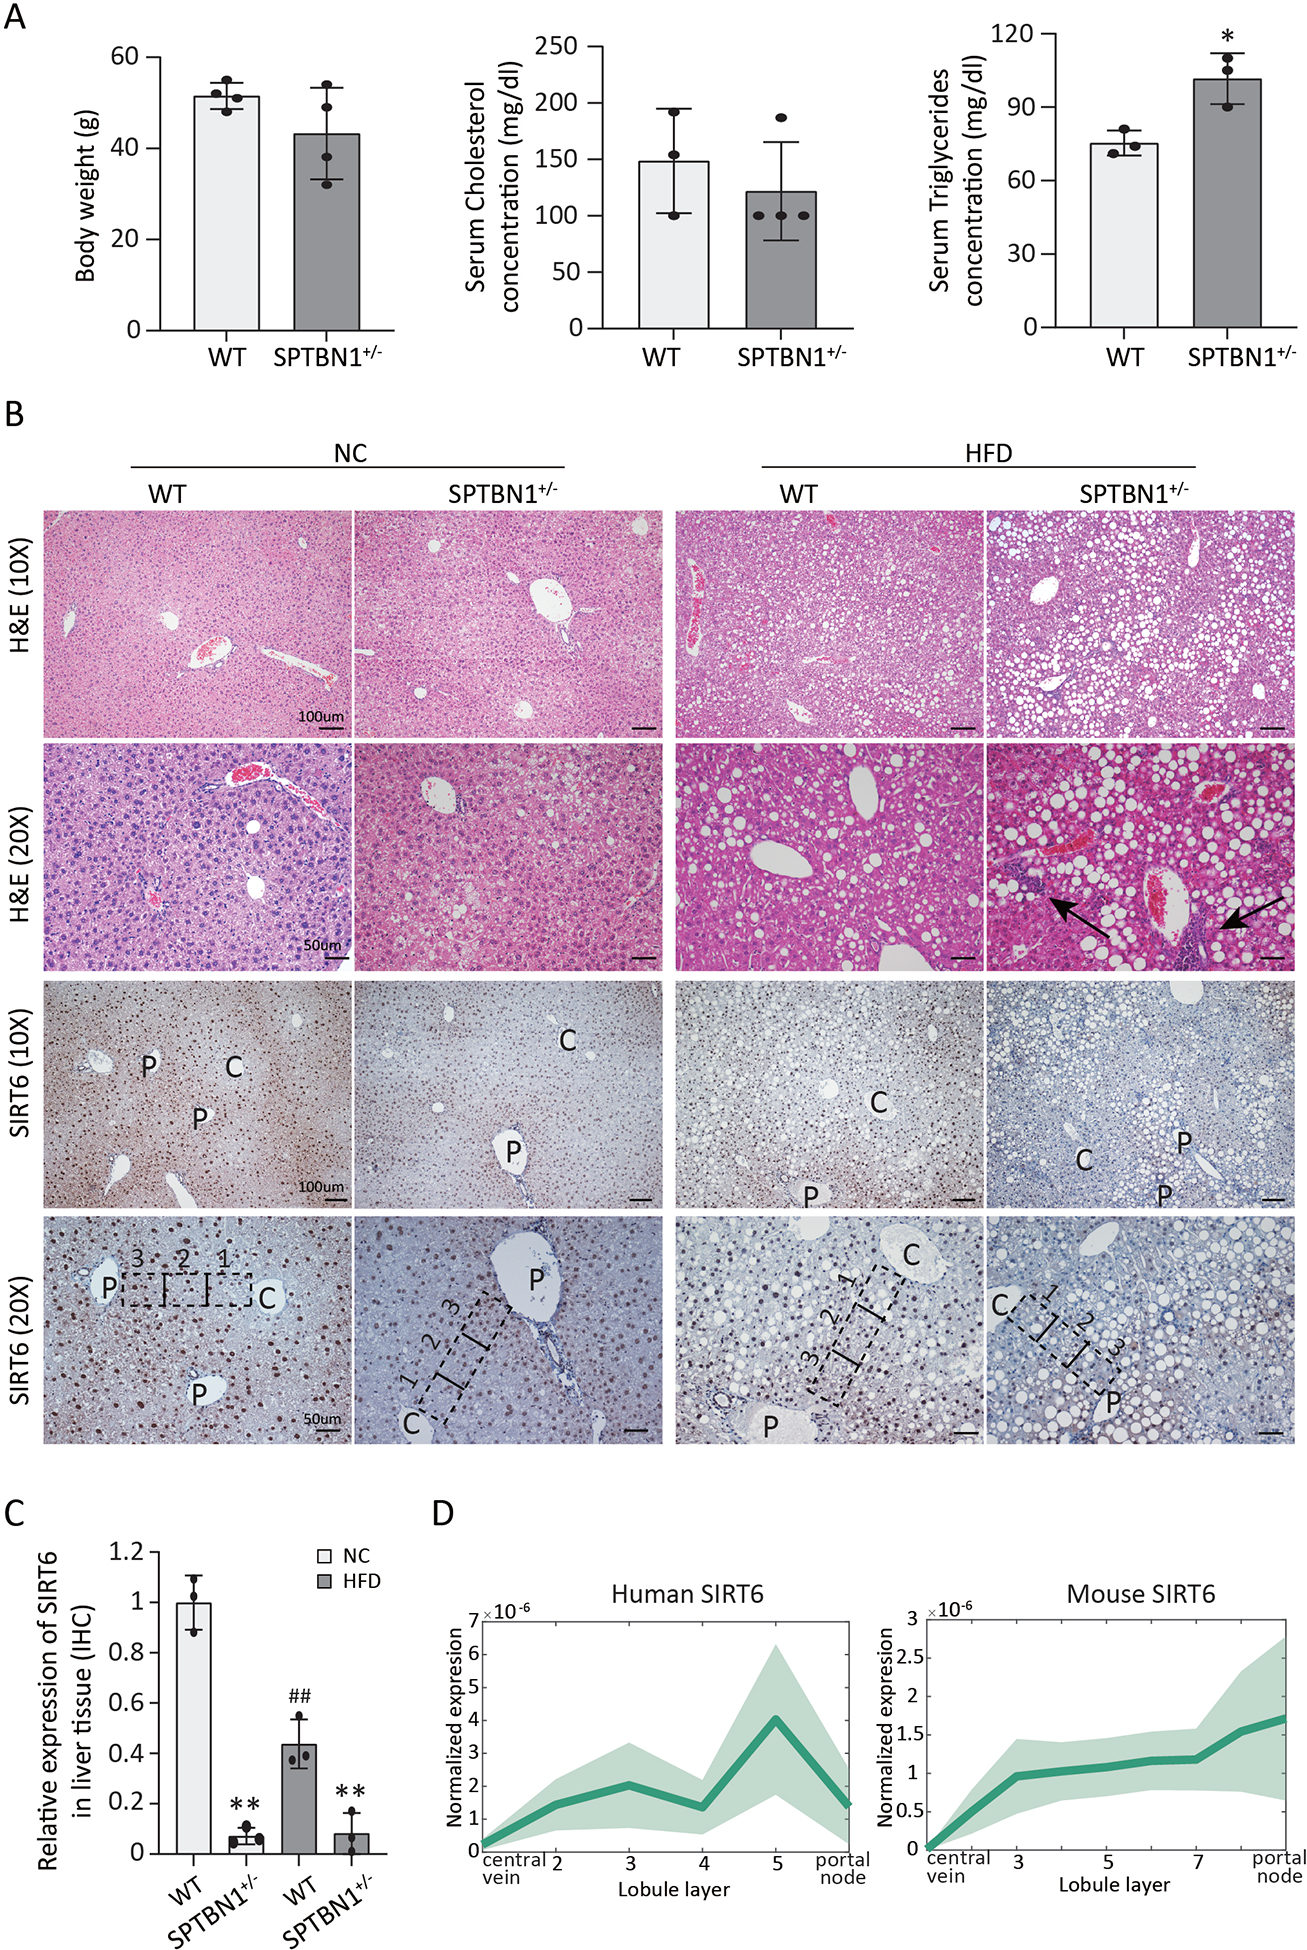
FIGURE 3. SPTBN1+/− mice have reduced SIRT6 abundance and develop HFD-induced liver steatosis.

WT or SPTBN1+/− mice (10 – 12 weeks old) were fed a normal chow (NC) diet or a HFD for 12 – 16 weeks. (A) Body weight and serum cholesterol and serum triglyceride concentrations are shown for mice after receiving a HFD for 12 – 16 weeks. Data are presented as mean ± SEM of 3 – 4 mice per group. *, p < 0.05 compared to WT. (B) Liver histology and SIRT6 immunohistochemistry (IHC) results are shown for mice after 12–16 weeks on the indicated diets. Hematoxylin & eosin (H&E) and IHC images are shown at two magnifications: 10×, scale bar = 100 μm; 20×, scale bar = 50 μm. C, central vein; P, portal tracts; arrows indicate inflammation. Representative zones between central vein and portal tracts are marked by the black dashed line:1, indicates area close to central vein; 2, indicates area in the middle; 3, indicates area close to portal tracts. (C) SIRT6 abundance was quantified from SIRT6 IHC in liver tissue from mice of the indicated genotypes (n = 3). **, p < 0.01; compared with WT group on the same diet; ##, p < 0.01, compared with WT group on NC diet. (D) Profiles of SIRT6 transcripts in the regions of the liver from the central vein to the portal node in human (left) and mouse (right). Each profile is normalized to the maximal expression across zones. The line indicates the mean, and the shaded region indicates the SEM.
