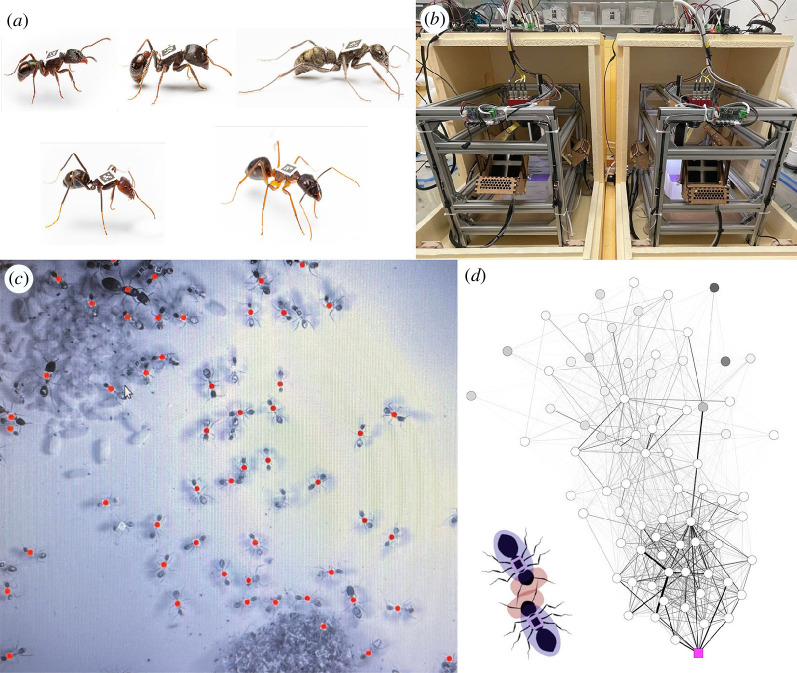
Figure 1.
Experimental overview. (a) Single workers of each of the study species. Clockwise from top-left: R. metallica, P rugosus, D. rugosum, C. fellah and I. purpureus. Images not to scale. Photo credit: Bart Zijlstra. (b) The double-box tracking set-up comprises two boxes positioned within two tracking systems that can be independently climatically controlled to simulate a nest box and a foraging box. (c) The automated detection of tags inside the tracking system. Red dots are superimposed onto the tags that have been recognized. (d) An example C. fellah social network. Edge colour intensity and width correspond to pairwise interaction frequency (darker and thicker, higher frequency). Circular nodes represent workers (coloured according to the proportion of time they spent in the foraging arena: darker, more time foraging), while the magenta square represents the queen. Edges are weighted and node positions are defined by a force-directed layout meaning that ants that interact more frequently are positioned closer together. Inset is an illustration of how interactions were detected through the intersection of ‘head capsules’.

