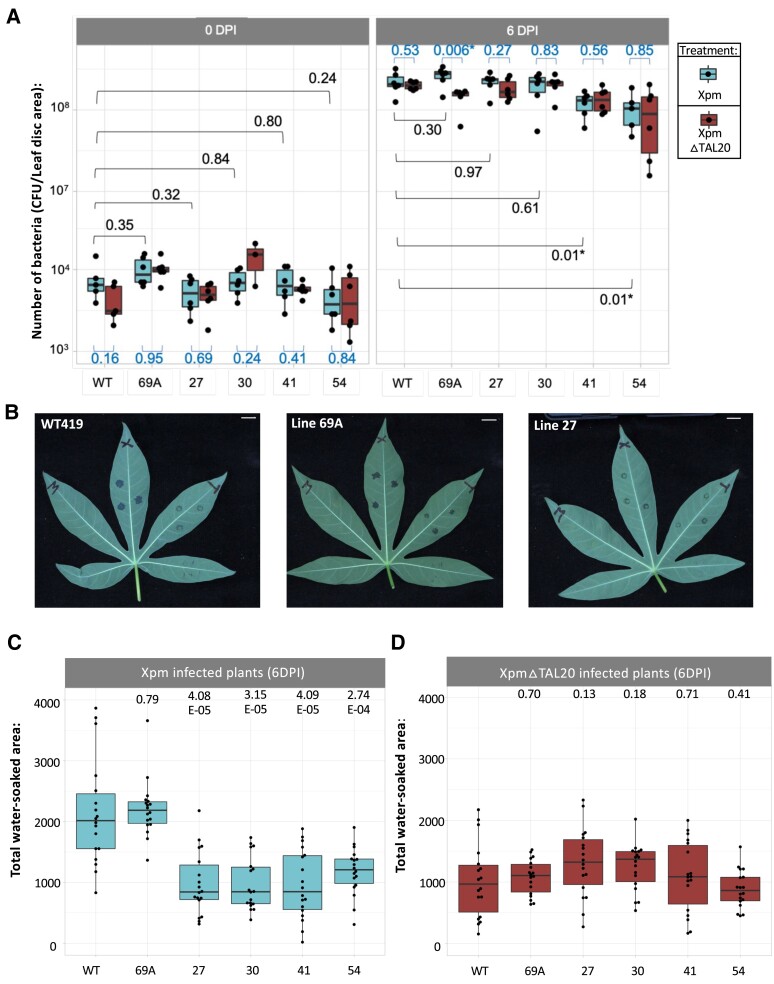
Figure 3.
MeSWEET10a mutant line CBB disease symptoms post Xpm infection. A) Number of bacteria in cassava leaves measured at 0 DPI (left) and 6 DPI (right) with Xpm and Xpm△TAL20 treatments. CFUs (CFU/leaf disk area, y axis) are plotted by plant genotype (x axis) tested (wild type or mutant). Dots represent sample replicates from an independent bacterial growth experiment. B) Representative images of infected wild-type (left), silent mutant line 69A (middle), and mutant line 27 (right) cassava leaves detached from the plant and imaged at 4 DPI. X, Xpm; T, Xpm△TAL20; M, mock. Scale bar = 1 cm. C) Total water-soaked area (pixels, y axis) of Xpm-infected plants (genotypes, x axis) at 6DPI. D) Total water-soaked area (pixels, y axis) of Xpm△TAL20-infected plants (genotypes, x axis) at 6 DPI. Dots represent individual water-soaked lesions from 3 independent water-soaking assay experiments combined. In all boxplots, the calculated P-values (unpaired Student’s t test with unequal variance) are shown above or below each box plot. Dots outside whiskers represent outliers based on default settings of the R package ggplot2. The horizontal line within the box represents the median sample value. The ends of the boxes represent the 3rd (Q3) and 1st (Q1) quartiles. The whiskers show values that are 1.5 times interquartile range (1.5 × IQR) above and below Q1 and Q3.

