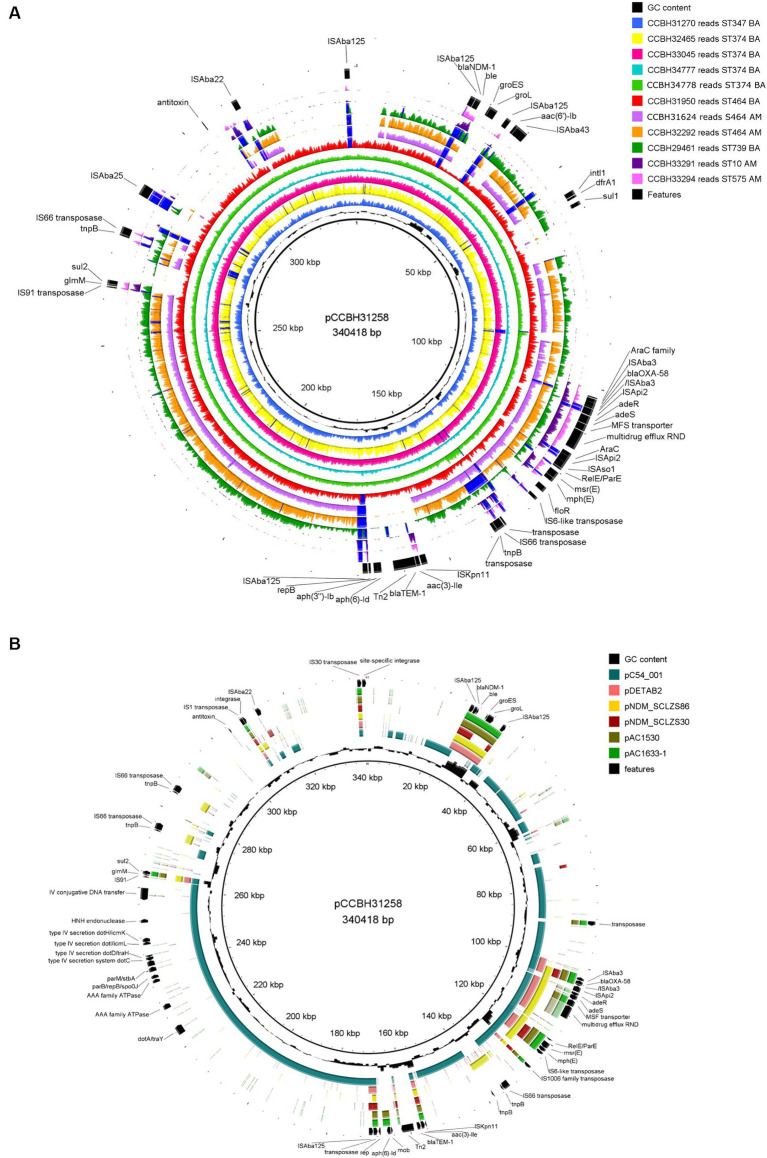
Figure 2.
Genomic comparison of plasmid pCCBH31258 with (A) other Acinetobacter baumannii strains from this study and (B) selected plasmids from GenBank: pC54_001 (CP042365.1), pDETAB2 (CP047975.1) (Liu et al., 2021), pNDM_SCLZS86 (CP090865.1) (Li et al., 2022b), pNDM_SCLZS30 (CP090384.1) (Li et al., 2022a), pAC1530 (CP045561.1) (Alattraqchi et al., 2021), and pAC1633-1 (CP059301) (Alattraqchi et al., 2021). Inside out, the first ring is the plasmid pCCBH31258, used as a reference (CP101888.1). In (A), each strain was represented by its reads mapping coverage against the reference plasmid. The “graph maximum value” was set to 400x, which represents the maximum coverage peak shown. Regions with coverage over 400x were highlighted in dark blue. In (A,B), the last ring represents relevant features in the reference. BA: Bahia state; AM: Amazonas state.

